African easterly waves (AEW) have a large influence on weather in the African Sahel region, and are known to provide seed disturbances for many Atlantic tropical cyclones (TC). Because of all the factors that can affect the development of a TC (SST, shear, etc.), it is difficult to know how any given change in AEW activity will affect the climatology of Atlantic TCs. This paper is one the few that has tried to characterize future AEW activity from the model projections (CMIP5).
In some of my own explorations, I found evidence that AEW occurrence will decrease in the future, albeit in only one model. So I was surprised to find that this paper found the opposite. Their results suggest that AEWs increase in both occurrence and intensity when the climate is forced with elevated CO2. They show that the enhancement mostly occurs in the northern storm track.
“AEW energy increases directly due to an increase in baroclinicity associated with an enhanced meridional temperature gradient… the pattern of low-level warming supports AEW development by enhancing monsoon flow, resulting in greater convergence and uplift along the Intertropical Front.”
In general, AEWs exist because of a reversal of the meridional potential vorticity gradient, consistent with the Charney-Stern instability criteria (Charney and Stern 1962). The differences between the southern and northern AEW storm tracks can be summarized as follows:
- Southern track:
- waves grow by both barotropic and baroclinic energy conversions
- Strongest circulation occursaround 700mb
- Wave strength typically maximizes around 11°N
- Moist convection plays a large role in dynamics
- More often involved in TC genesis than northern storms
- Northern track:
- Waves grow mostly through baroclinic energy conversion
- Strongest circulation occurs around 850mb
- Wave strength typically maximizes around 20°N
- Moist convection plays a smaller role
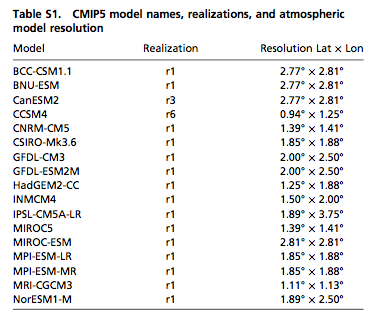
The authors of this study use a subset of CMIP5 models because, unfortunately, not all simulations provided daily data.
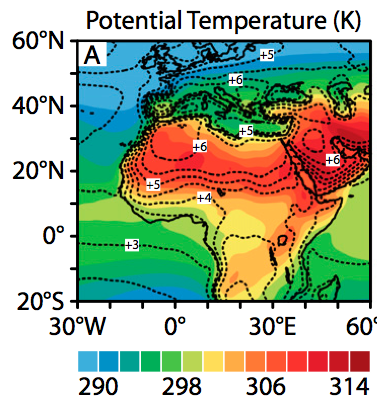
The change in meridional temperature gradient over West Africa can be seen in the figure below of the multi-model ensemble mean surface potential temperature (shaded), and the difference between future and current scenarios.
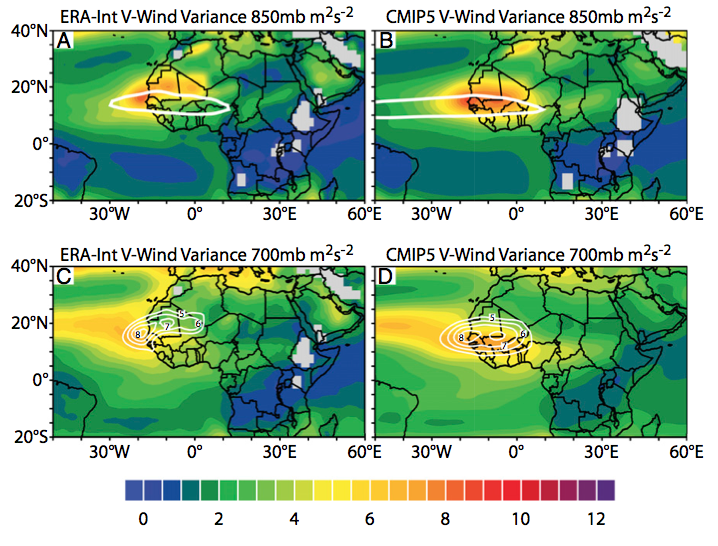
The authors use this next figure to argue that the models produce a reasonable climatology of variability associated with AEWs. Looking closer at the individual models in the supplemental material, I was surprised to see a very large spread in the meridional wind variance. many of these models have very large variances compared to current ERA-interim data. The authors acknowledge that there is also a lack of distinction between the northern and southern storm tracks.
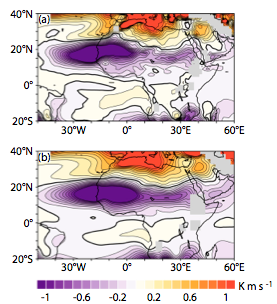
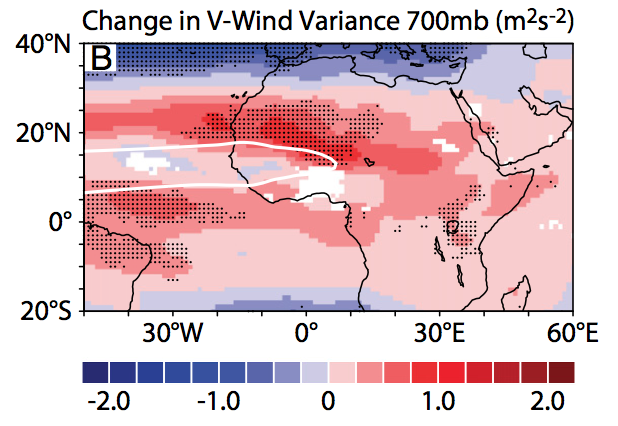
This next figure nicely shows their main result. The enhancement of northern track AEWs is clear and robust. The southern track variability exhibits a positive change in the multi-model mean, but the lack of stippling indicates that less than 50% of the models have a statistically significant change. The white area is where the models have a statistically significant change but do not agree on the sign.
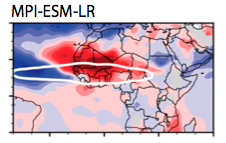
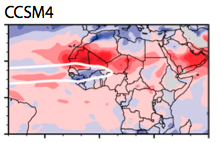
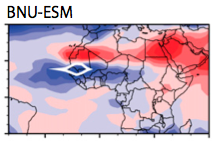
This plot looked convincing to me at first. However, looking at the individual models I’m more suspicious. Part of my suspicion has to do with the problem that none of these models have two distinct storm tracks. Also, some models appear to show a clear enhancement of the variance:
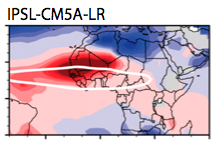
Whereas other models show a dipole pattern that could be indicative of a meridional “shift” of the storm track, rather than an enhancement of AEWs:
I wish they had published a more in depth analysis of what is going on in these simulations, but I bet that will come out in a future publication.
On a side note, in my opinion no one should ever publish a figure with saturated contours, like the one below from this paper’s supplemental material. I cannot think of a good reason to do this. I’ve heard people justify this practice by saying they want to focus on the smaller signal or details of a specific region. Even if that is the case, using saturated contours truncates the information in the plot, which provides a useful context to understand the weaker signals or patterns. I don’t often tout hard and fast rules, but this is an exception: Don’t let your contour plots saturate!