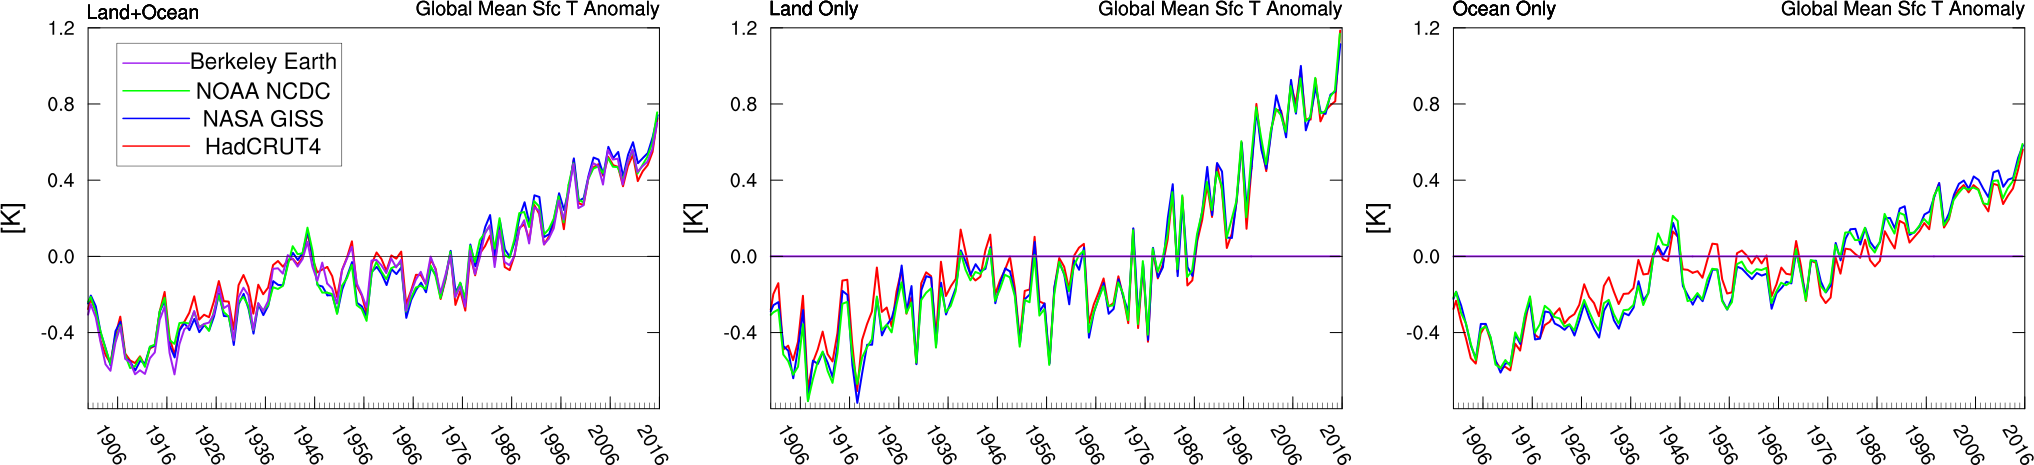
On my Global Climate page I have some long term time series of the annual global temperature, but these plots are a bit too coarse to see the recent variations in global temperature. So I created a new plot that covers that last couple years of monthly data to be able to look at this. I also included breakdowns of land vs ocean and hemispheric averages.The Long-term yearly time series is here:
The new fine-grain look at recent temperatures looks like this:
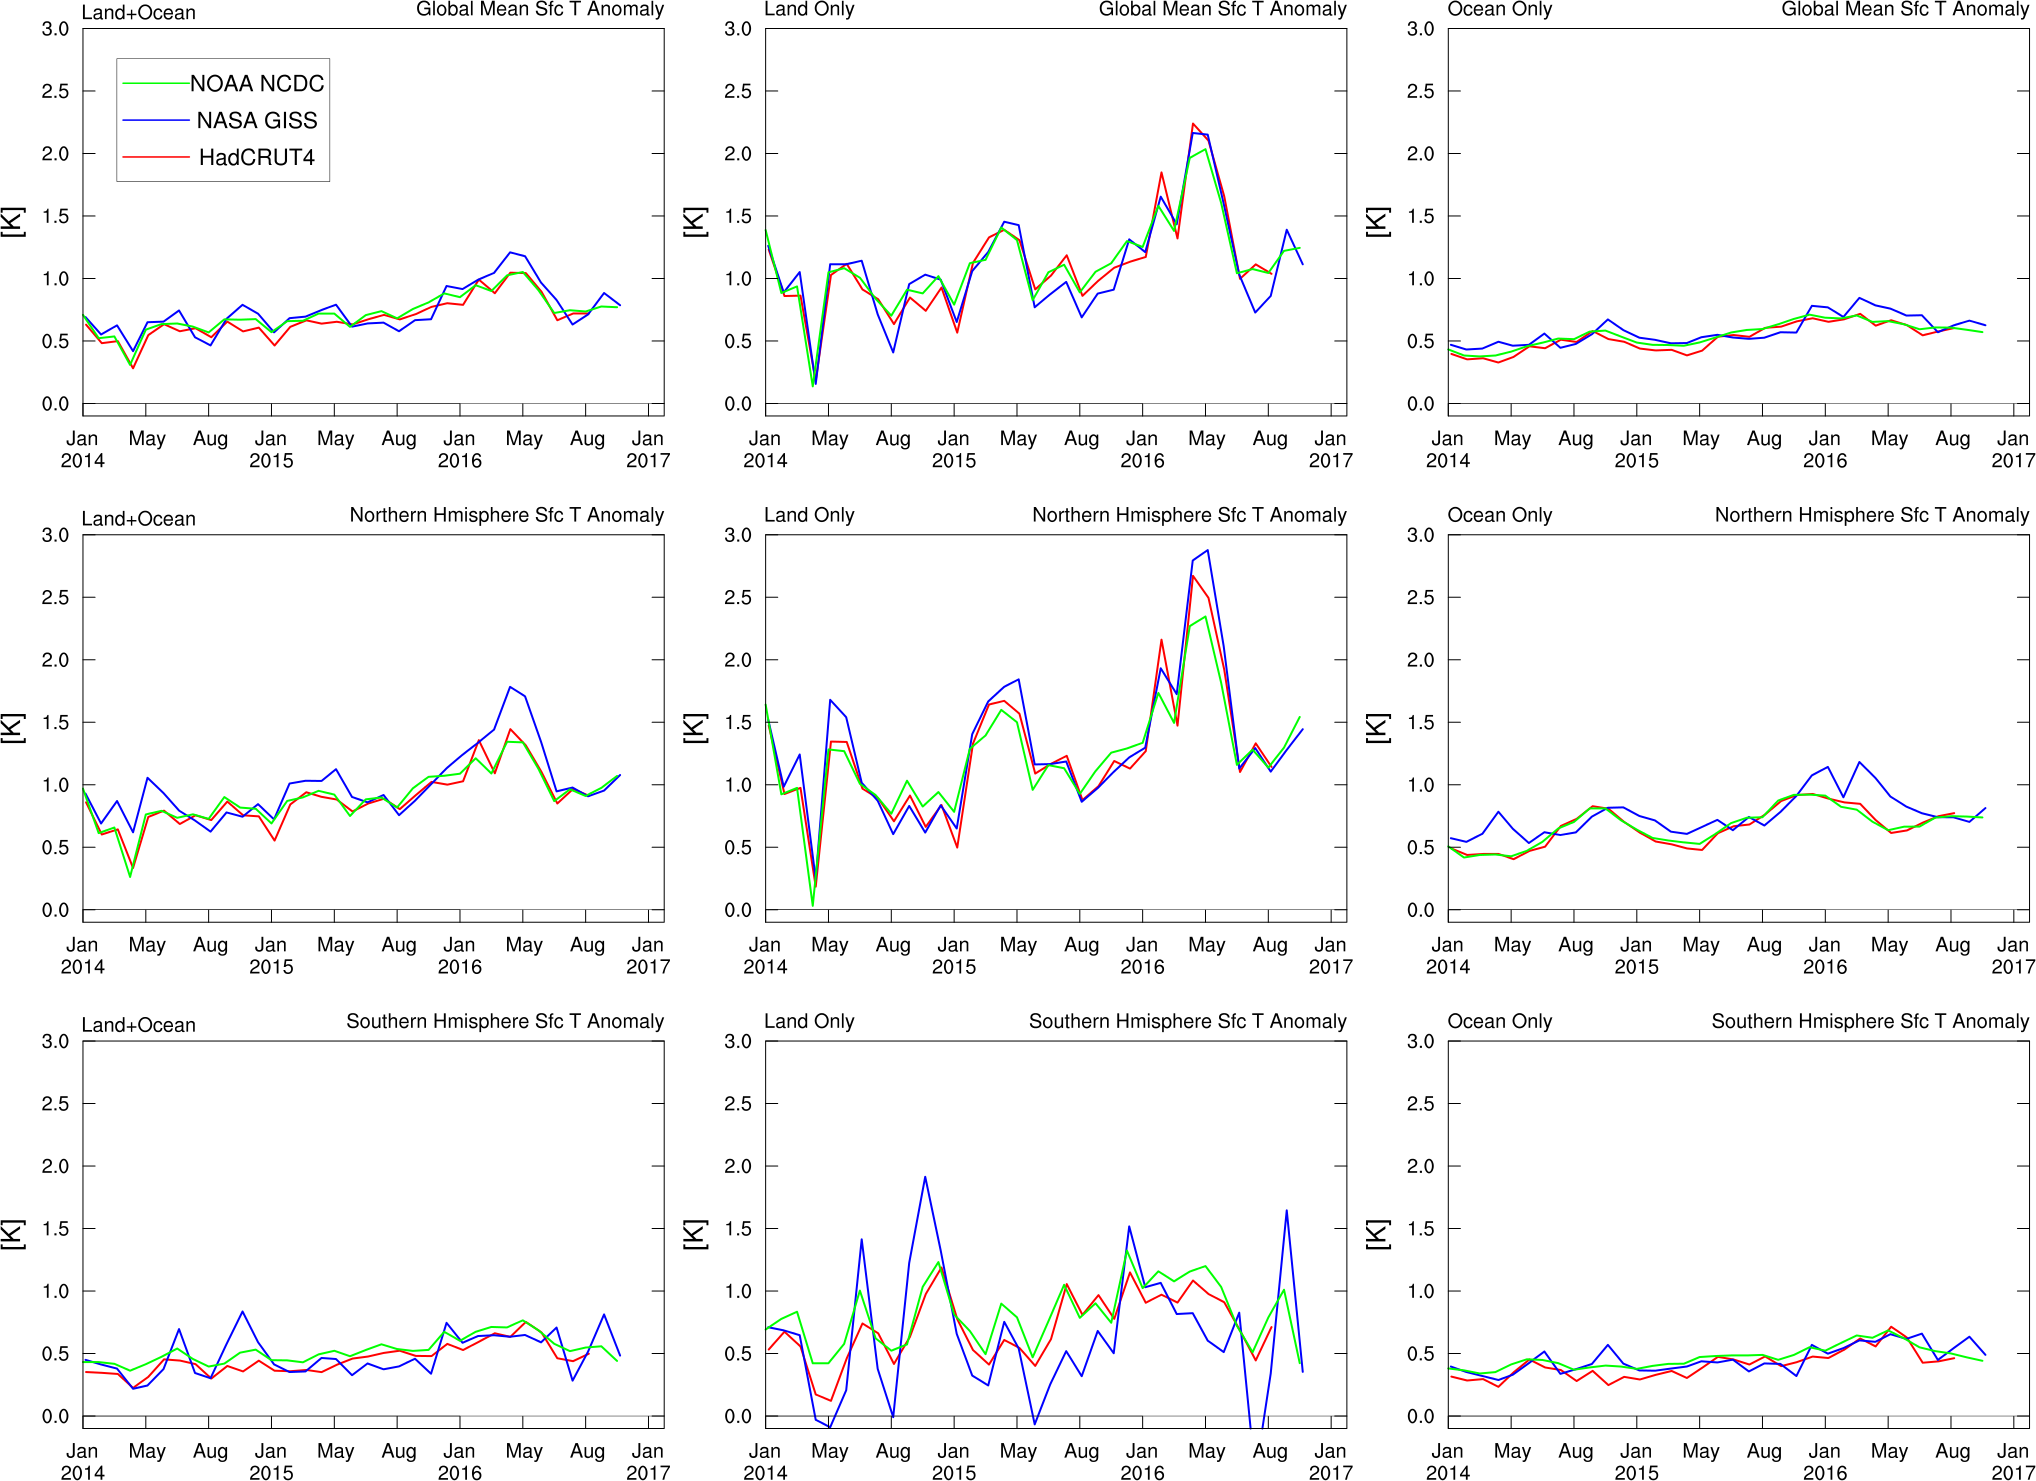
As in the yearly time series, there is pretty good agreement between the 3 datasets. I didn’t include the Berkeley data because I only have their global mean. I could add the Berkeley data, but it’ll take some extra work to get the data.
You might be tempted to attribute the spike in global temperature around May 2016 to El Nino, but it turns out that the high latitude Northern Hemisphere land signal is the largest contributor to the warming (see below).
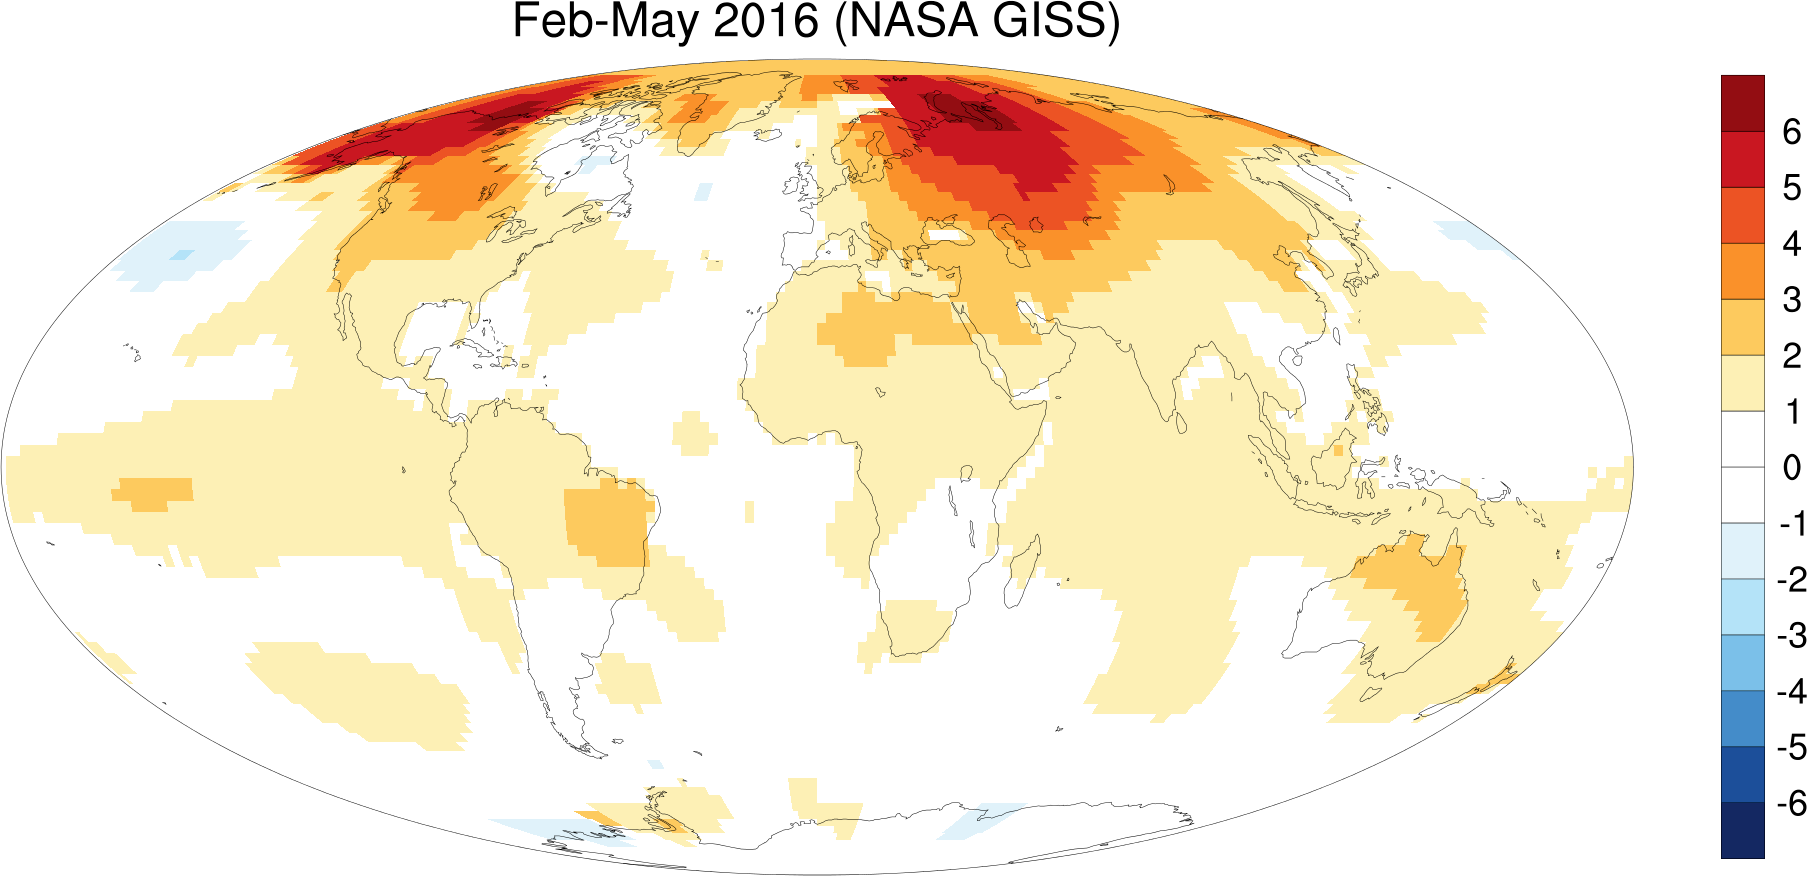
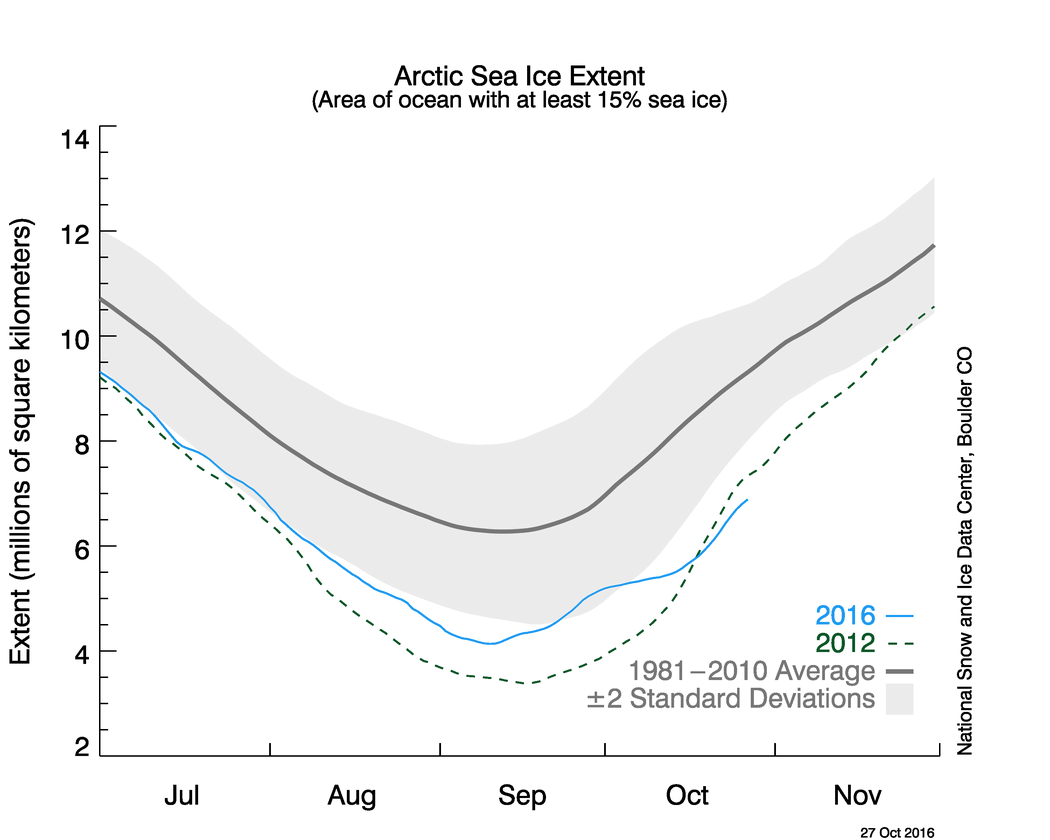
Interestingly, in spite of the extreme Arctic warming the Arctic sea ice extent still didn’t go as low as 2012 until recently. I suspect the explanation involves ocean dynamics.