I often find myself asking questions like, “what direction does the wind blow over Spain in the summer?” I’ve always thought it would be nice to have a bunch of maps of basic meteorological variables. Initially I was going to print out a bunch of maps or a big poster that I could post on my wall, but this would be a huge pain to change if I realized later on that the colors were a bad choice, or the vectors were too small.
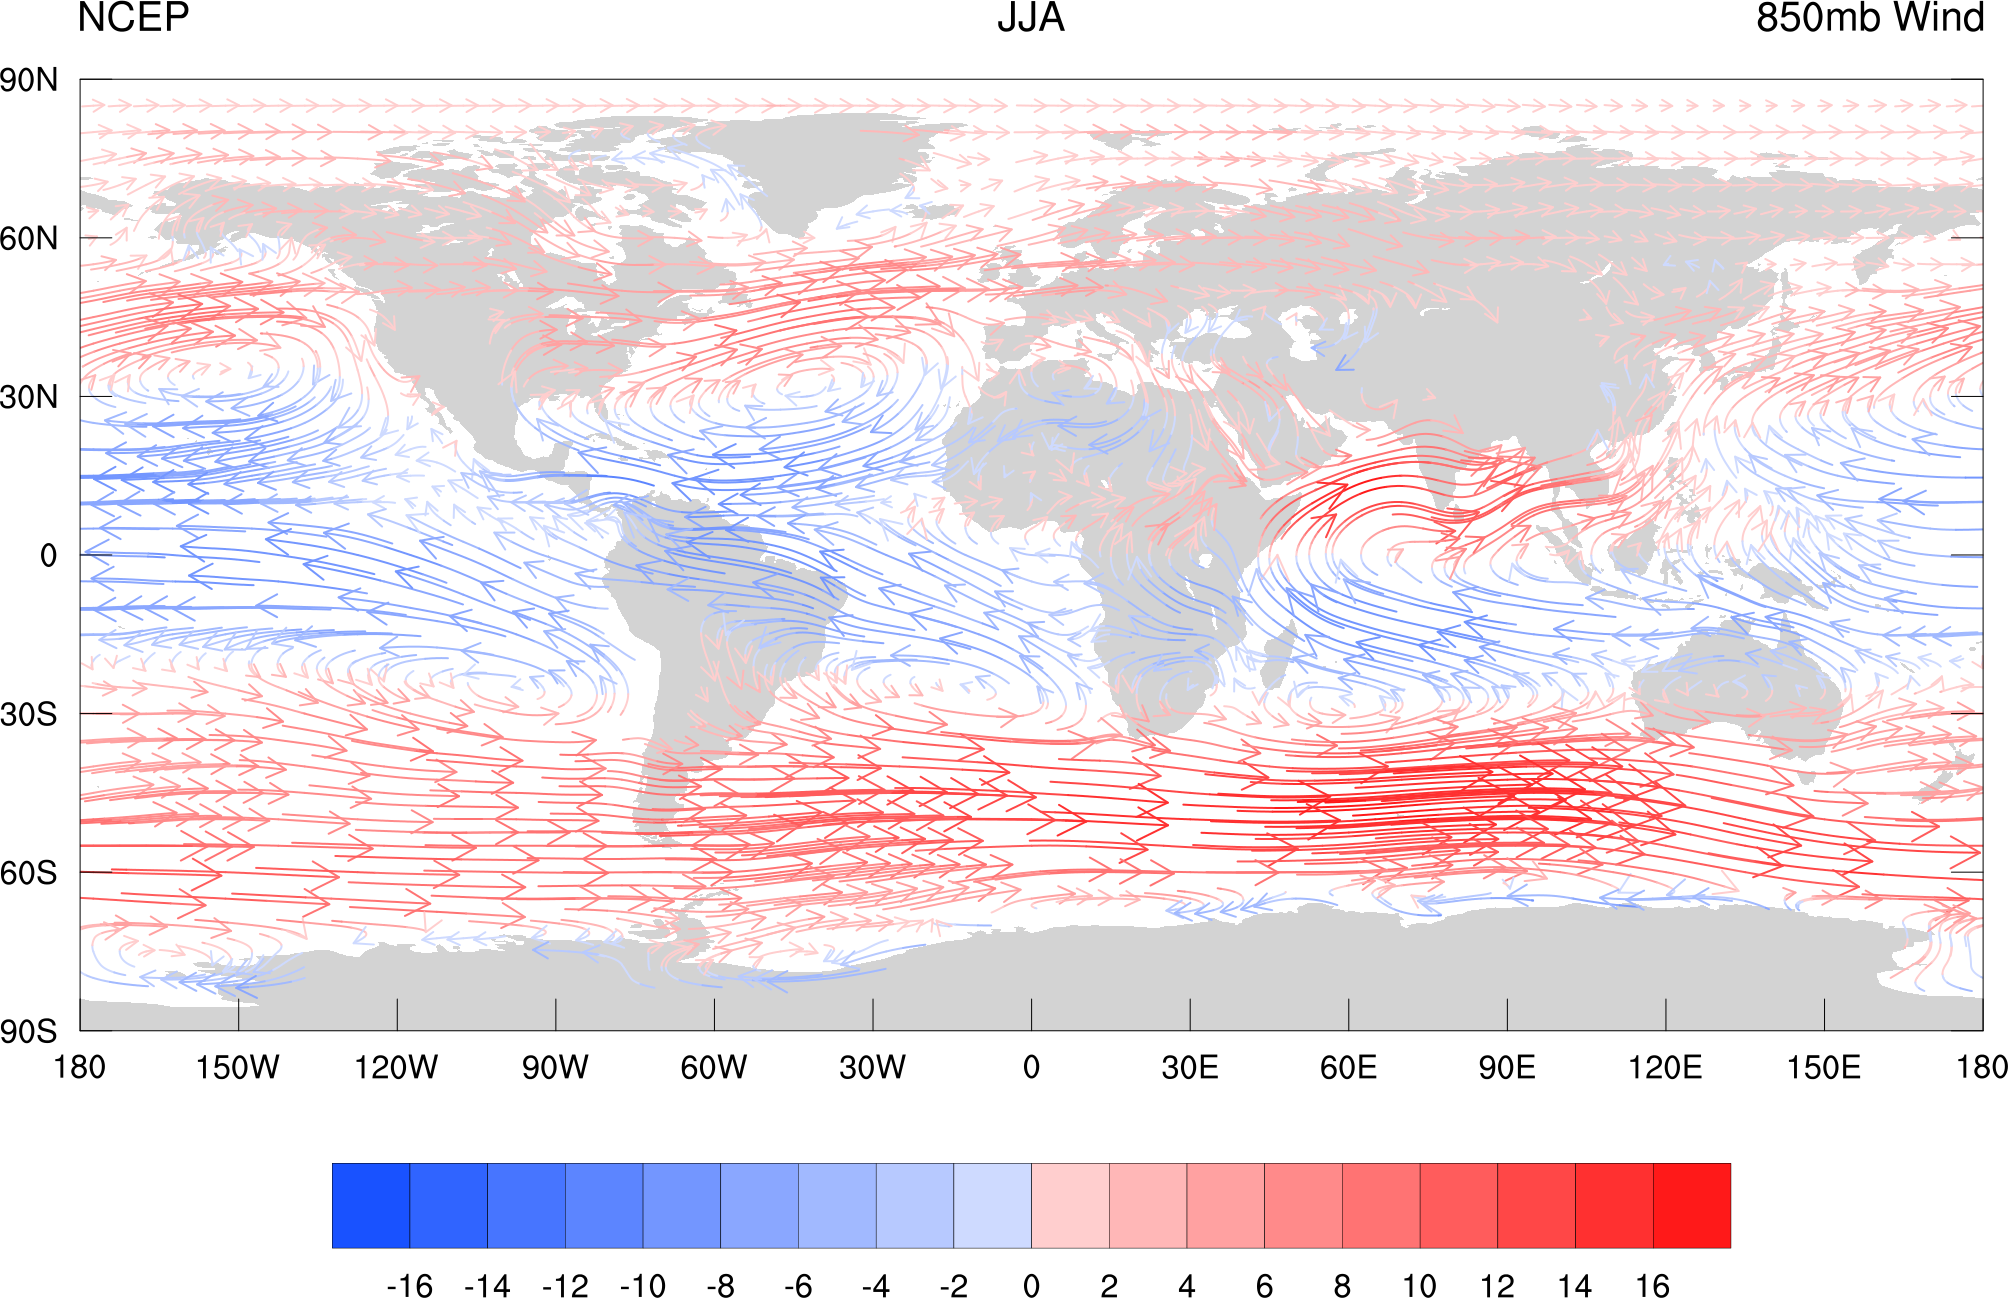
I decided a better way to do this was add a section to my website full of a bunch of maps that I can update whenever I need. Below is an example of the 850mb wind over June-August (JJA), from the NCEP 2 reanalysis, which currently covers 1979-2015.
I’ve posted a bunch of these maps on my Climate Data page. I only have upper and lower level winds now, but I’ll add a few more things in the coming weeks, such as surface temperature and relative humidity.
I realize that these type of figures can be found elsewhere on the web, but this is just for my own reference and a nice exercise in writing Python.
Feel free to email me with any suggestions on how to improve these maps!