
State of the Climate System
Below are some plots for monitoring the state of the climate system.
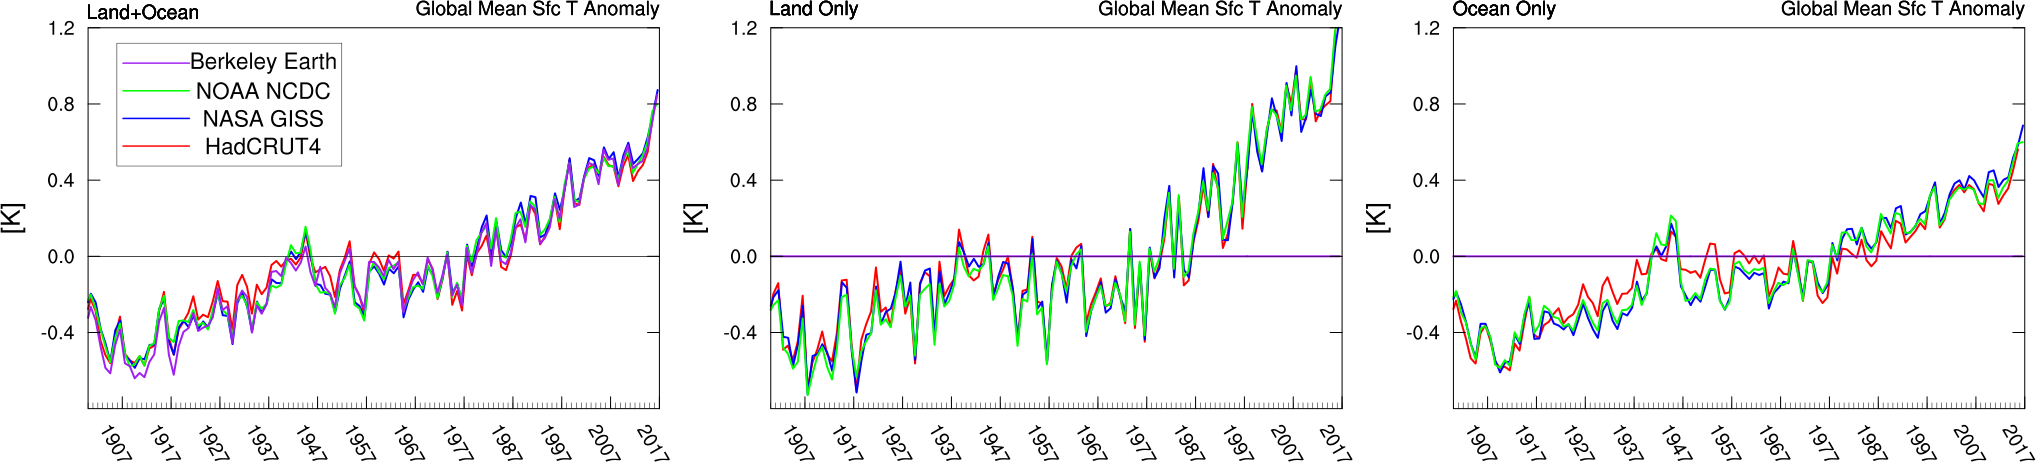
Time series of annual mean surface temperature (Anomaly from 1950-2000 mean) from various datasets for land+ocean (left), land only (center), and ocean only (right).
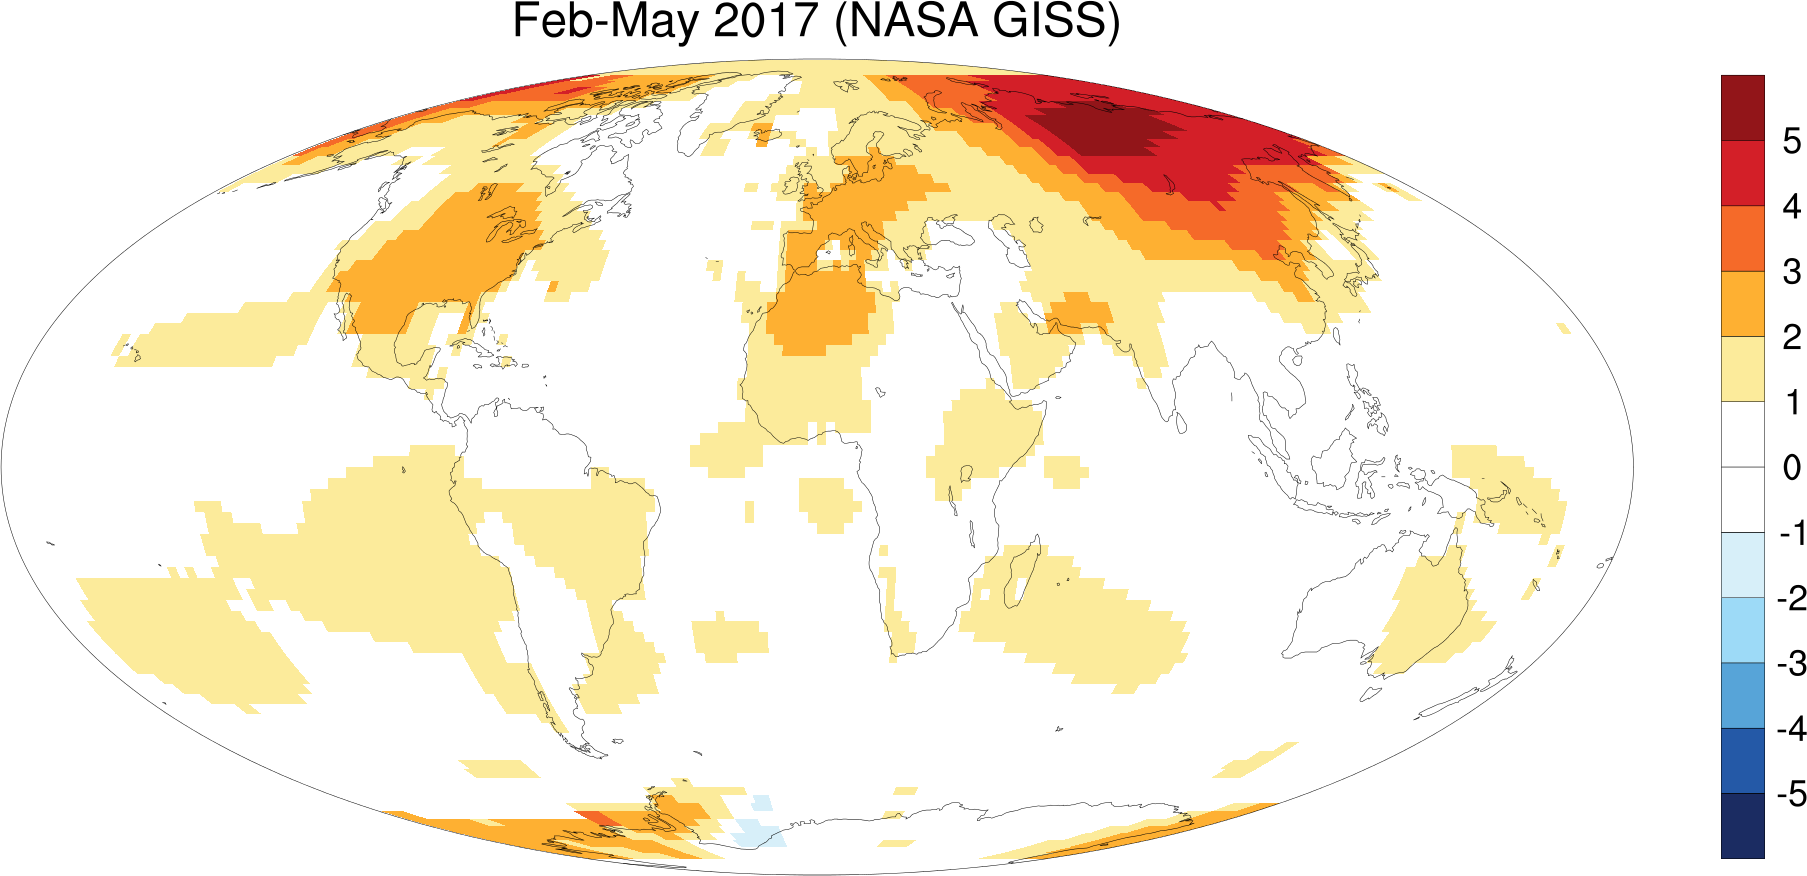
Map of current 3-month average surface temperature anomaly.

Monthly time series of recent global and hemispheric surface temperature anomalies.
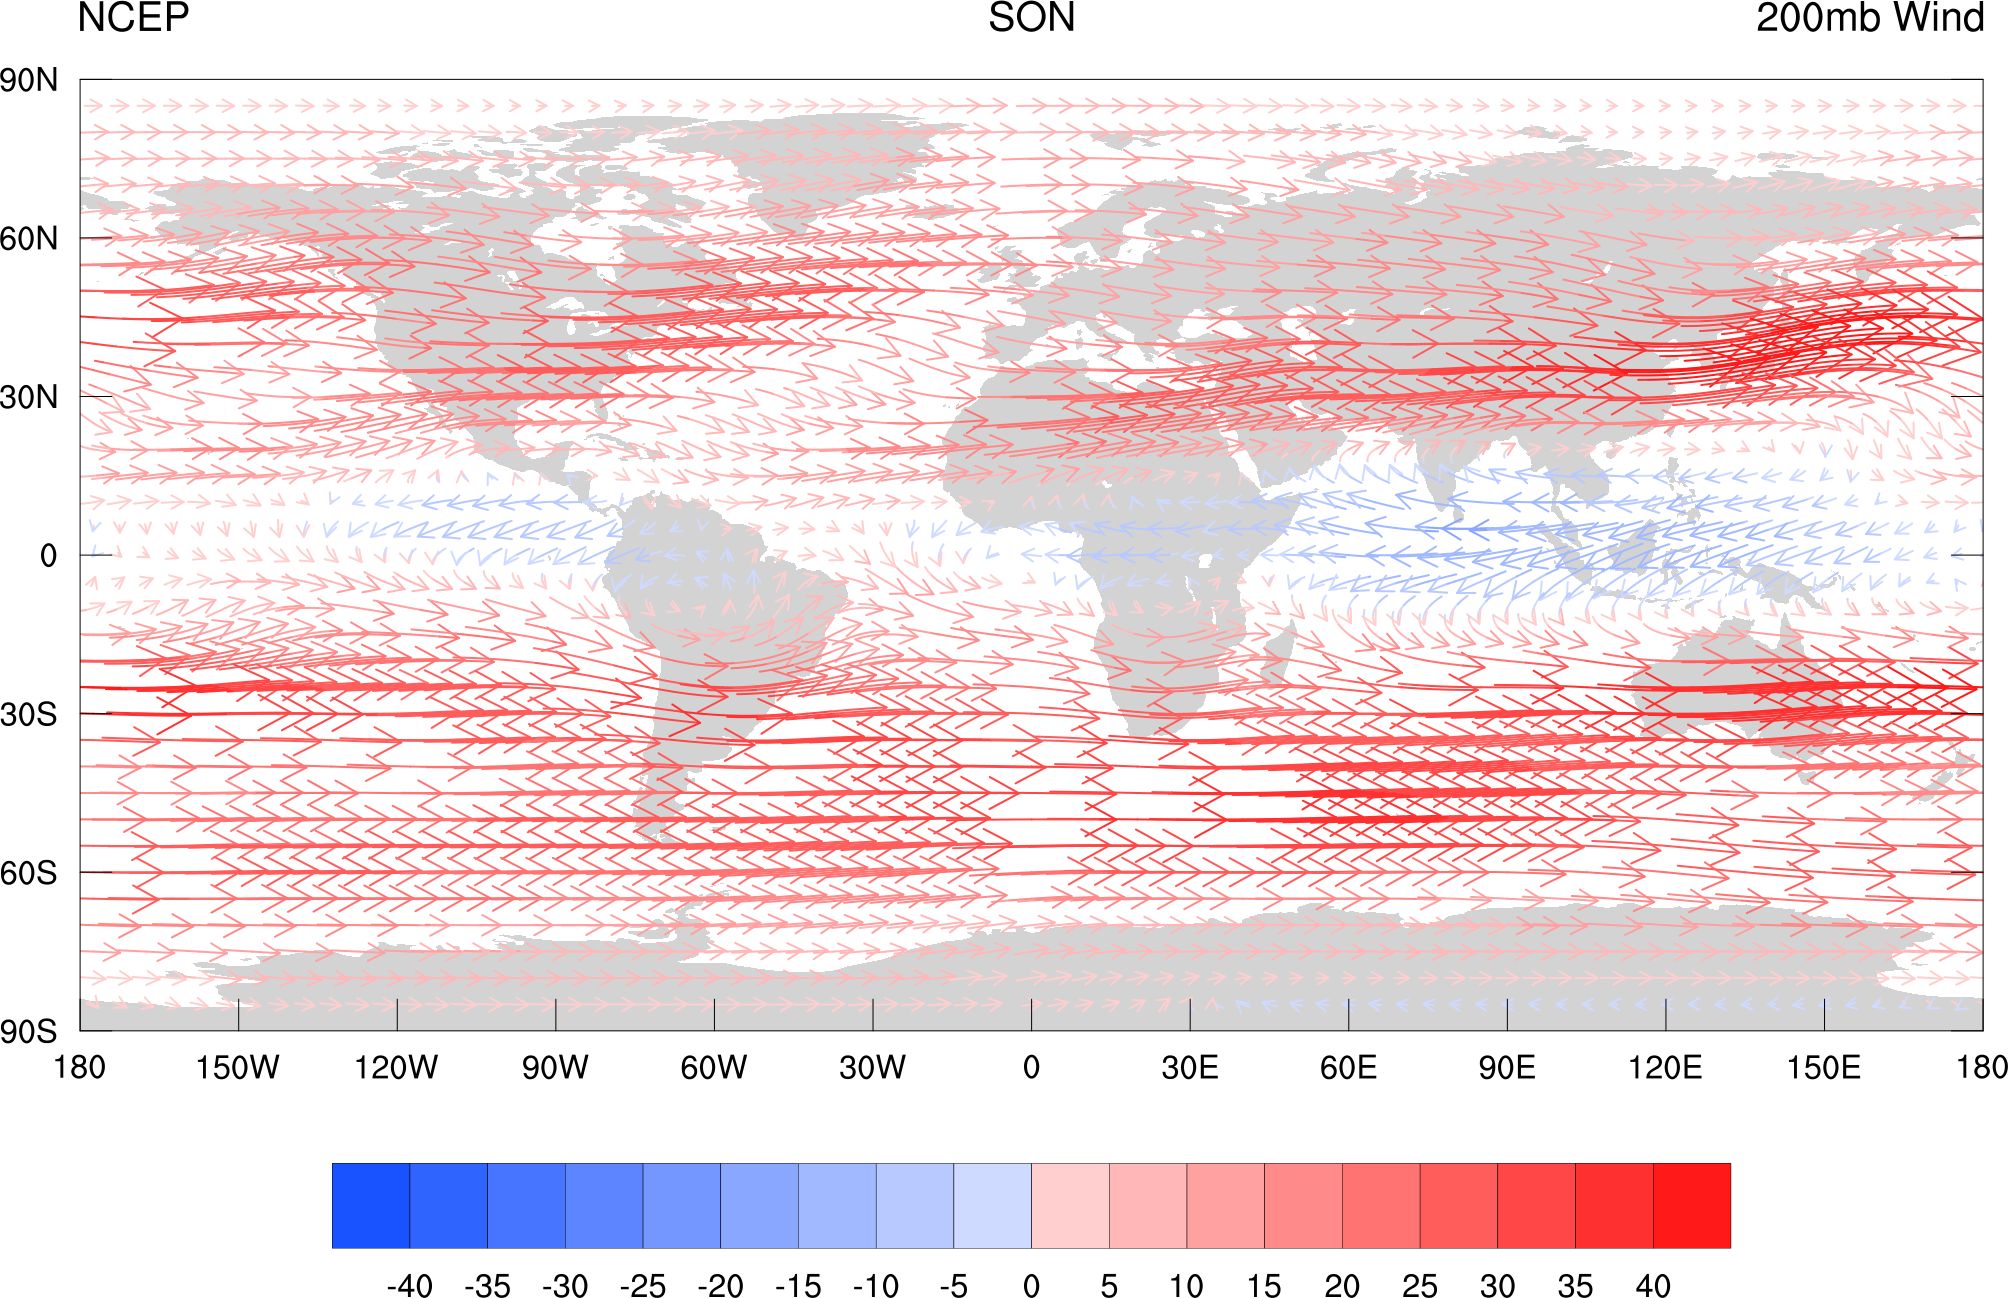
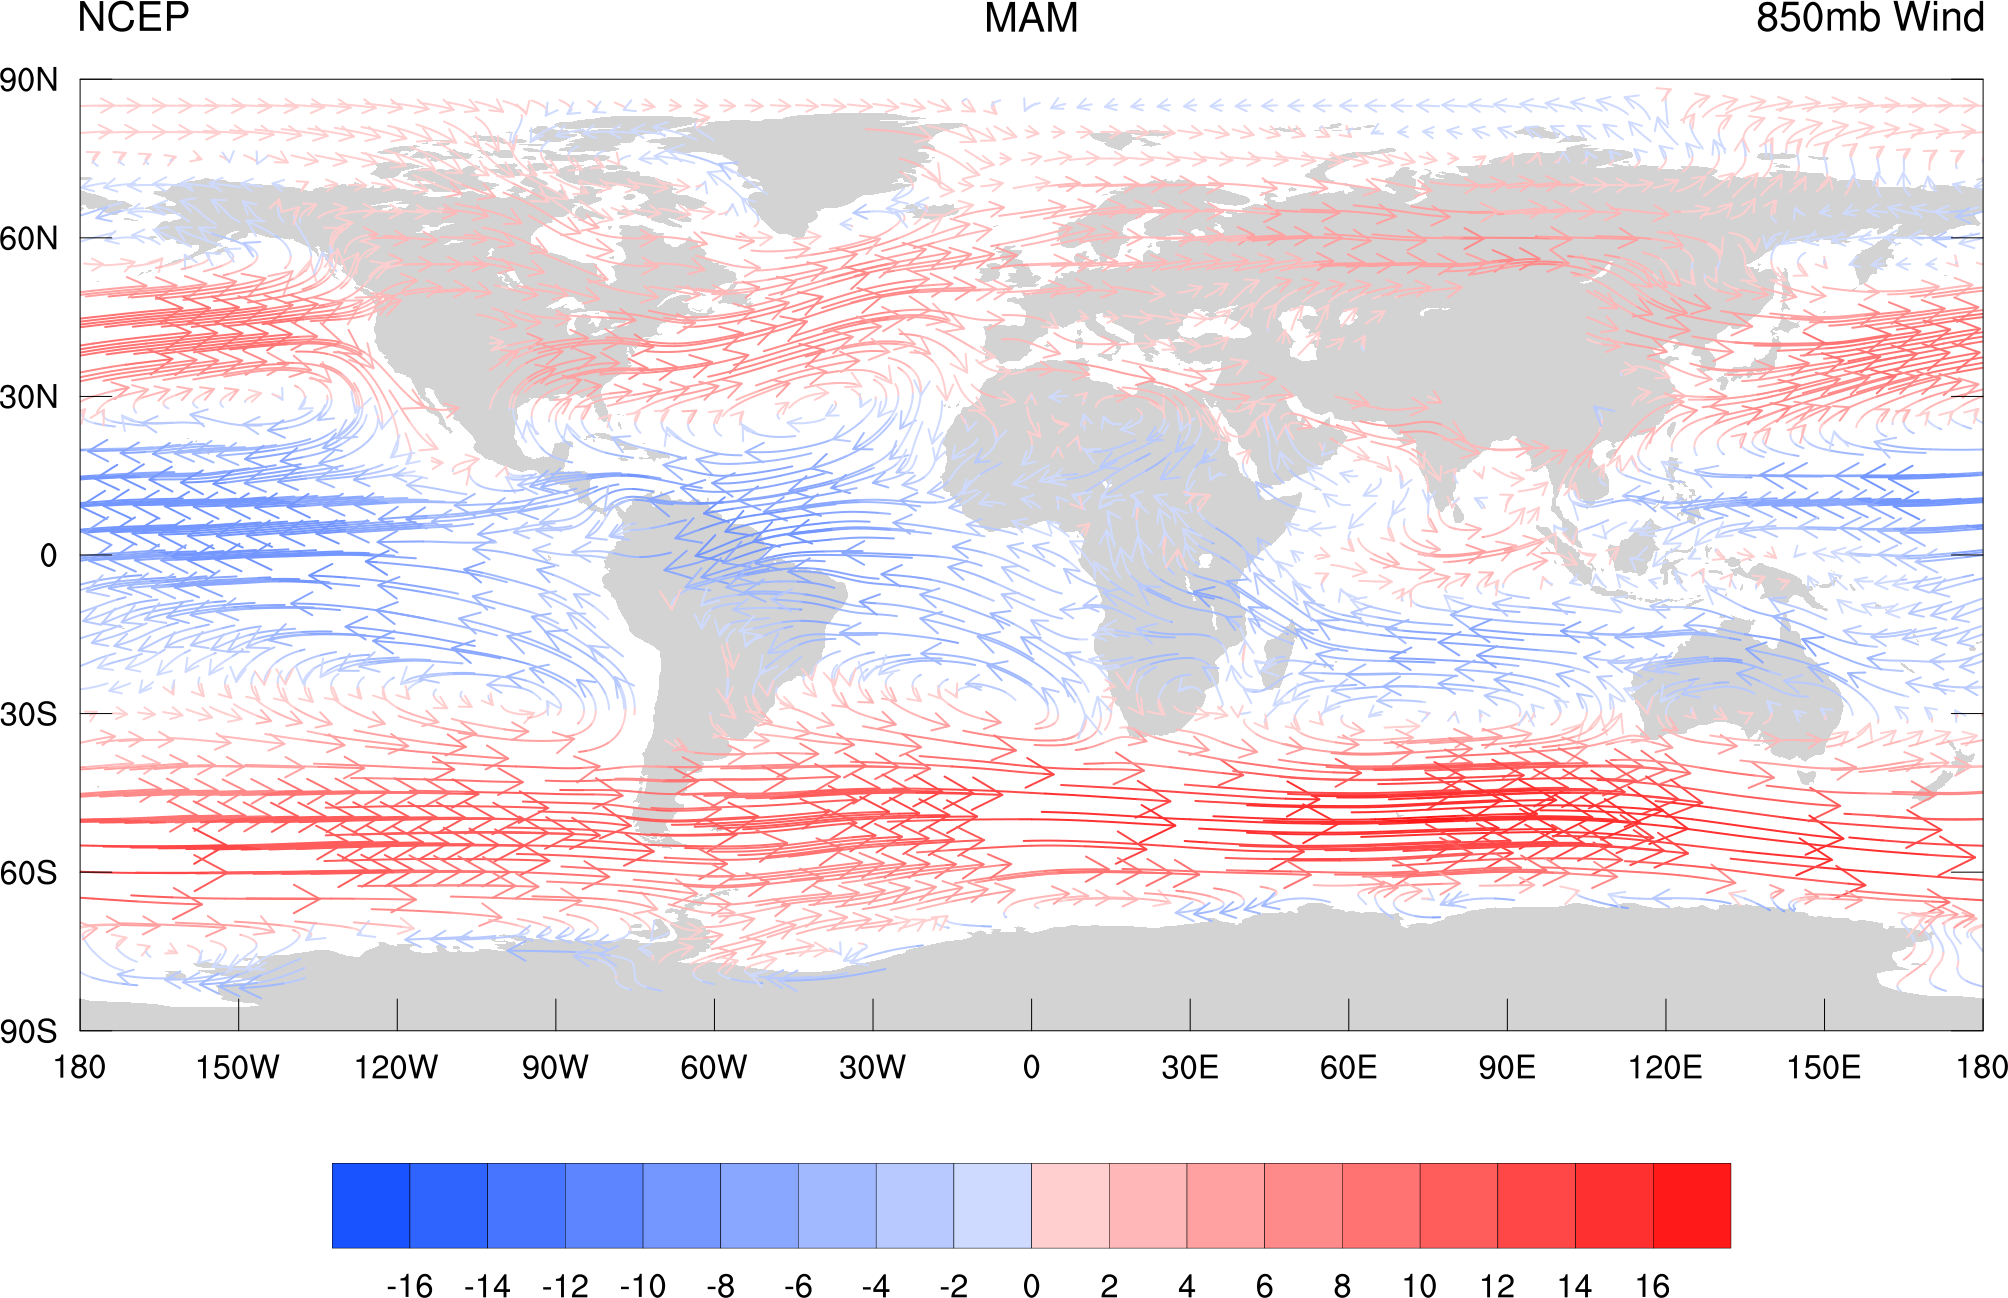
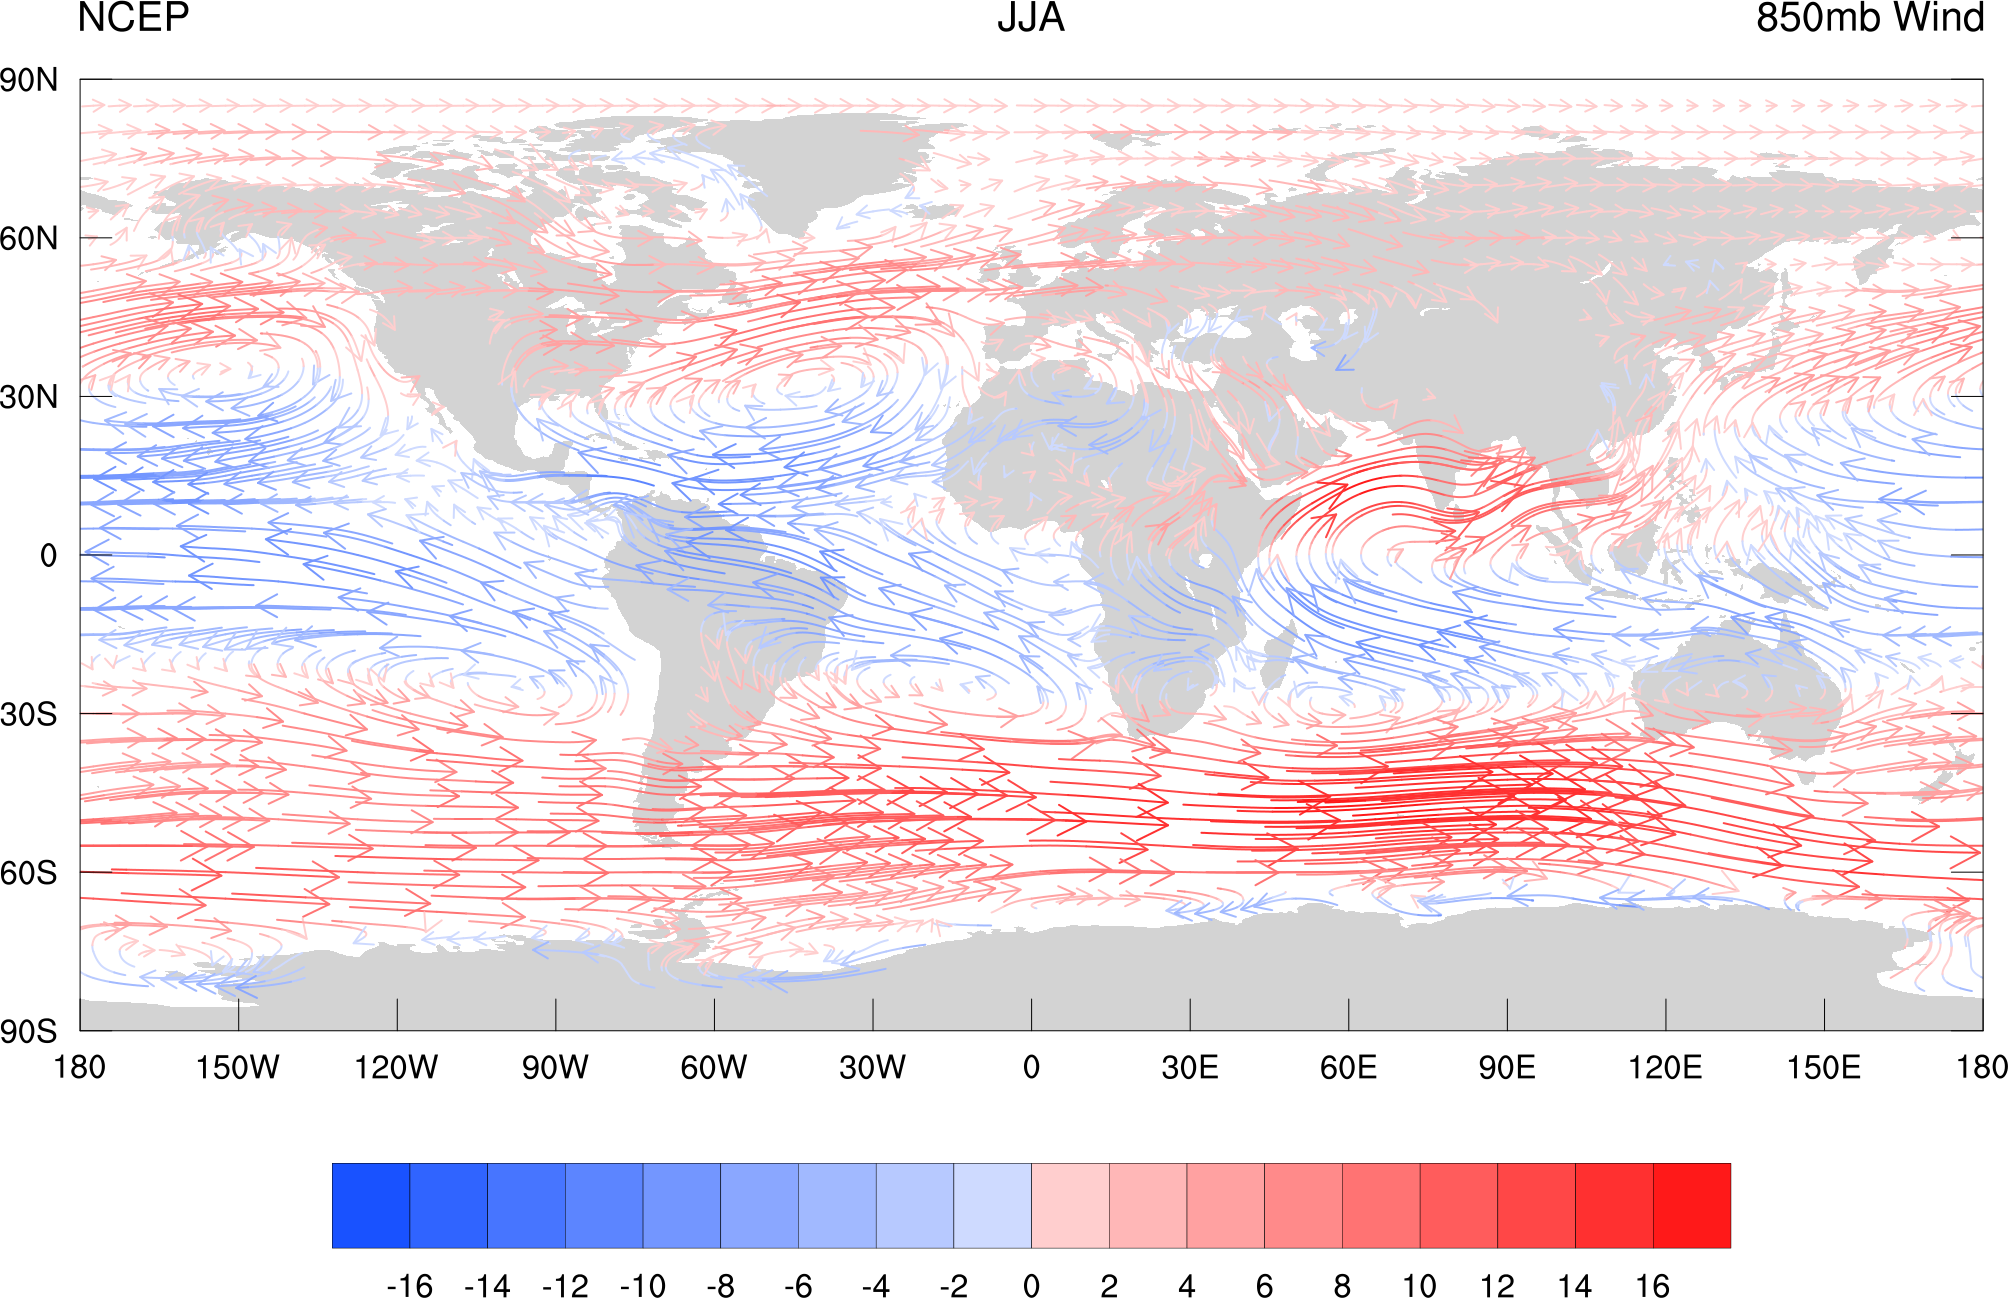
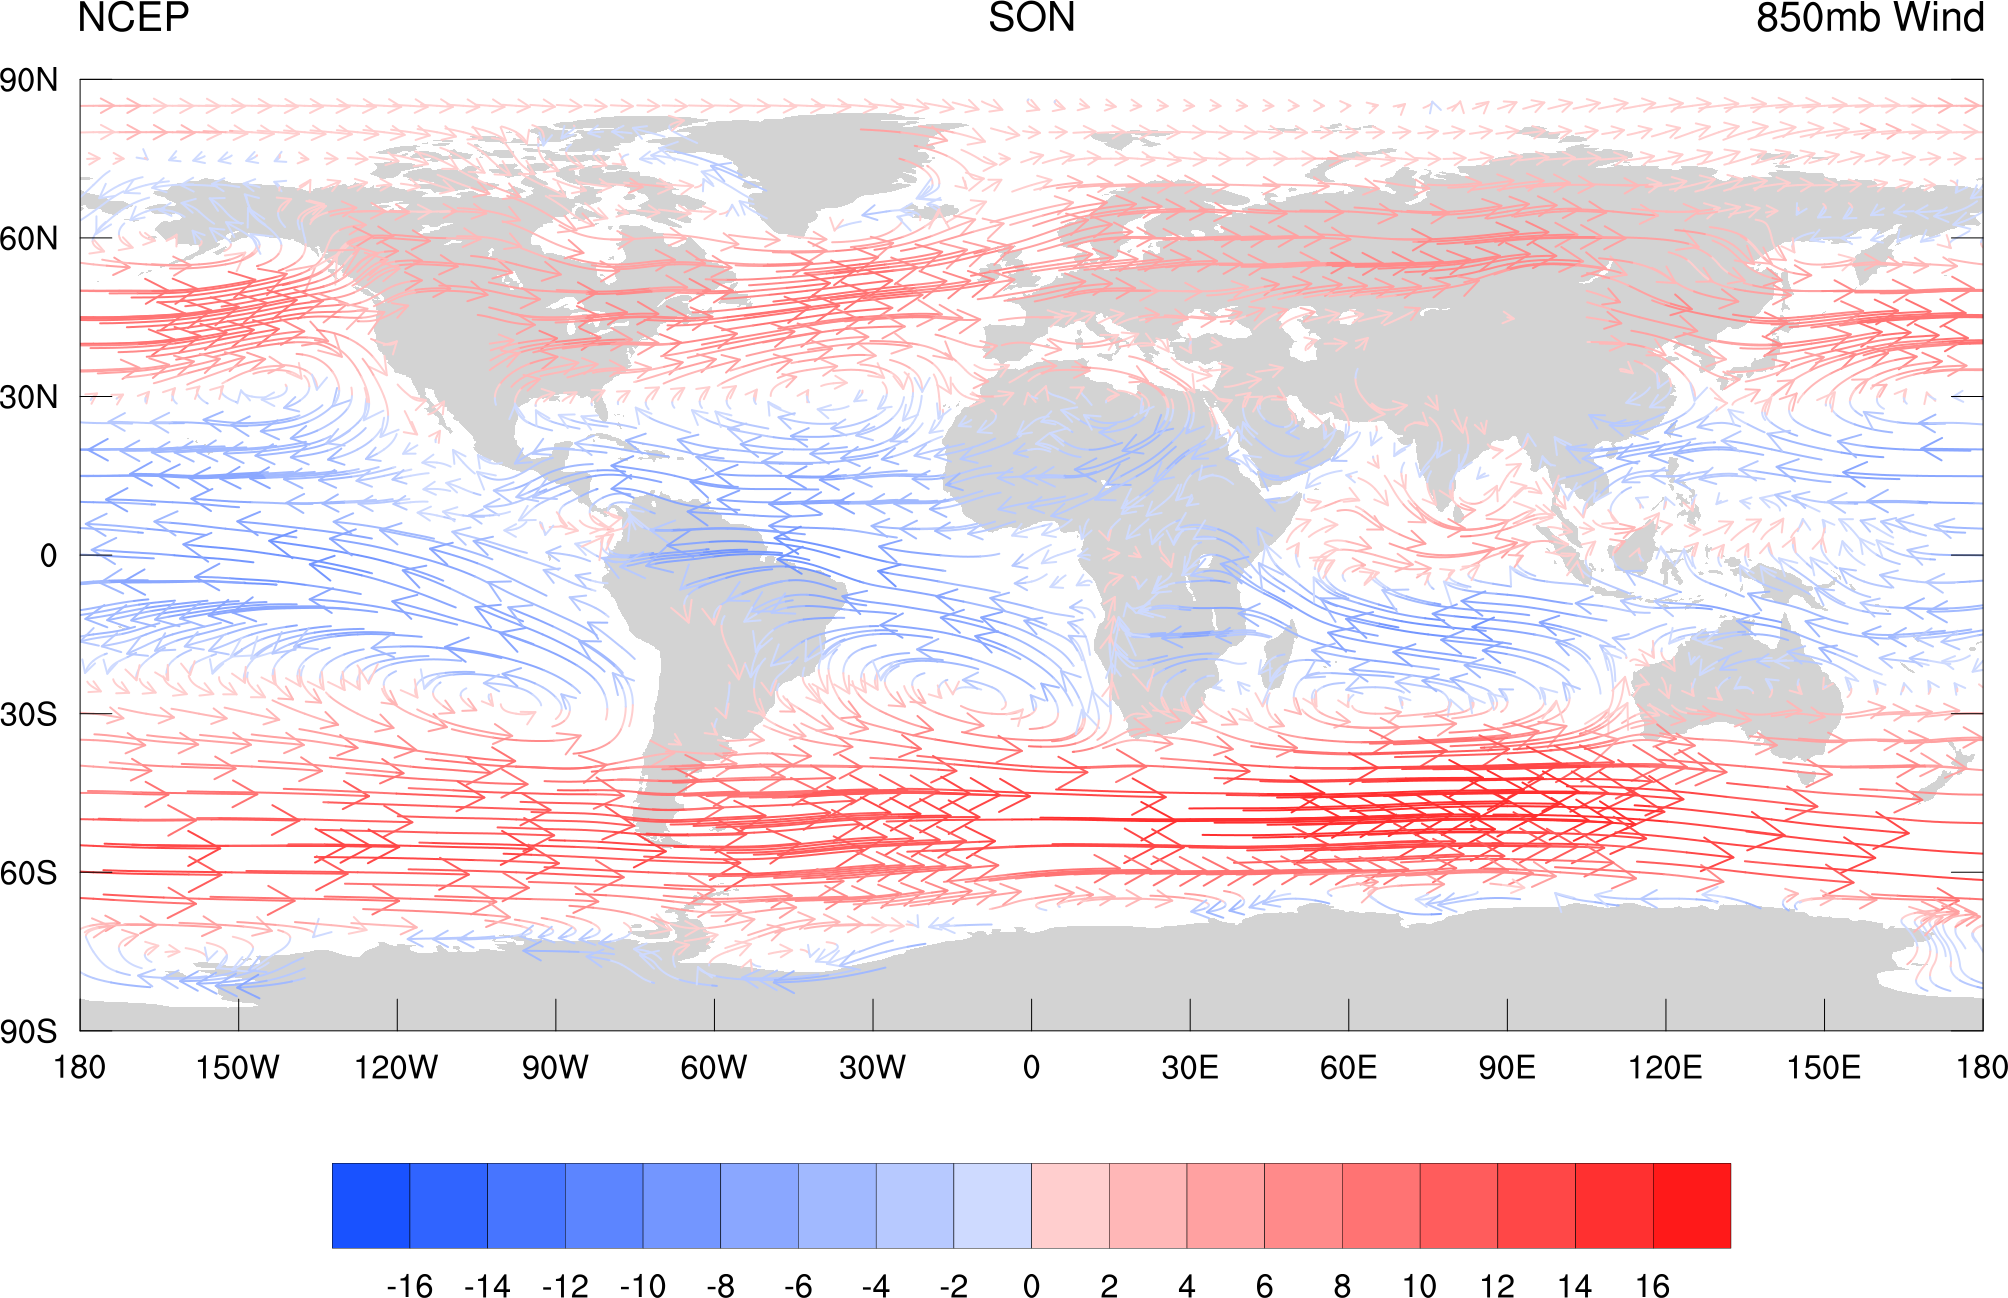
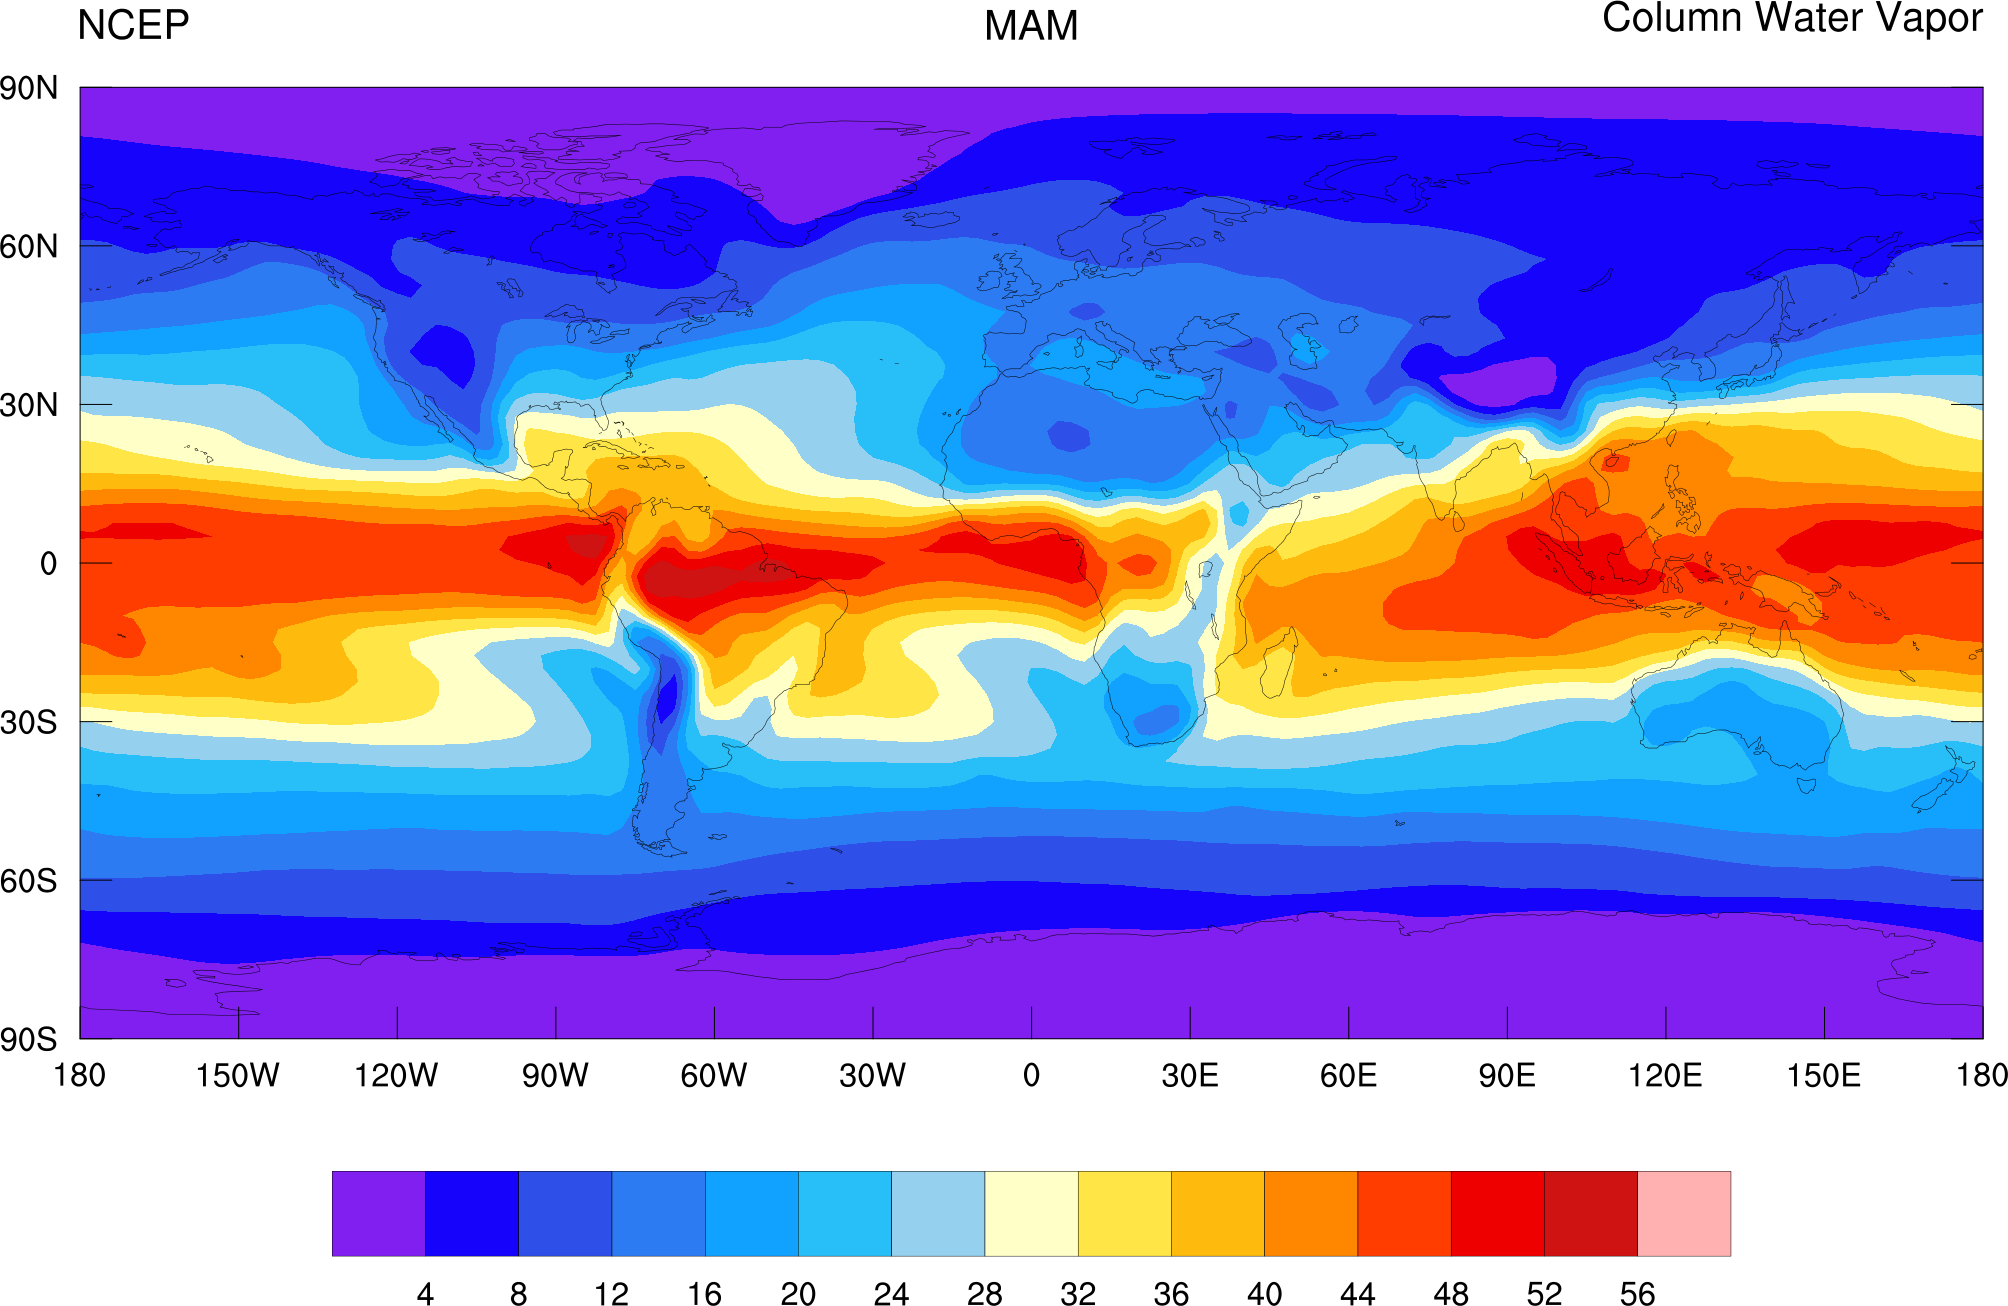
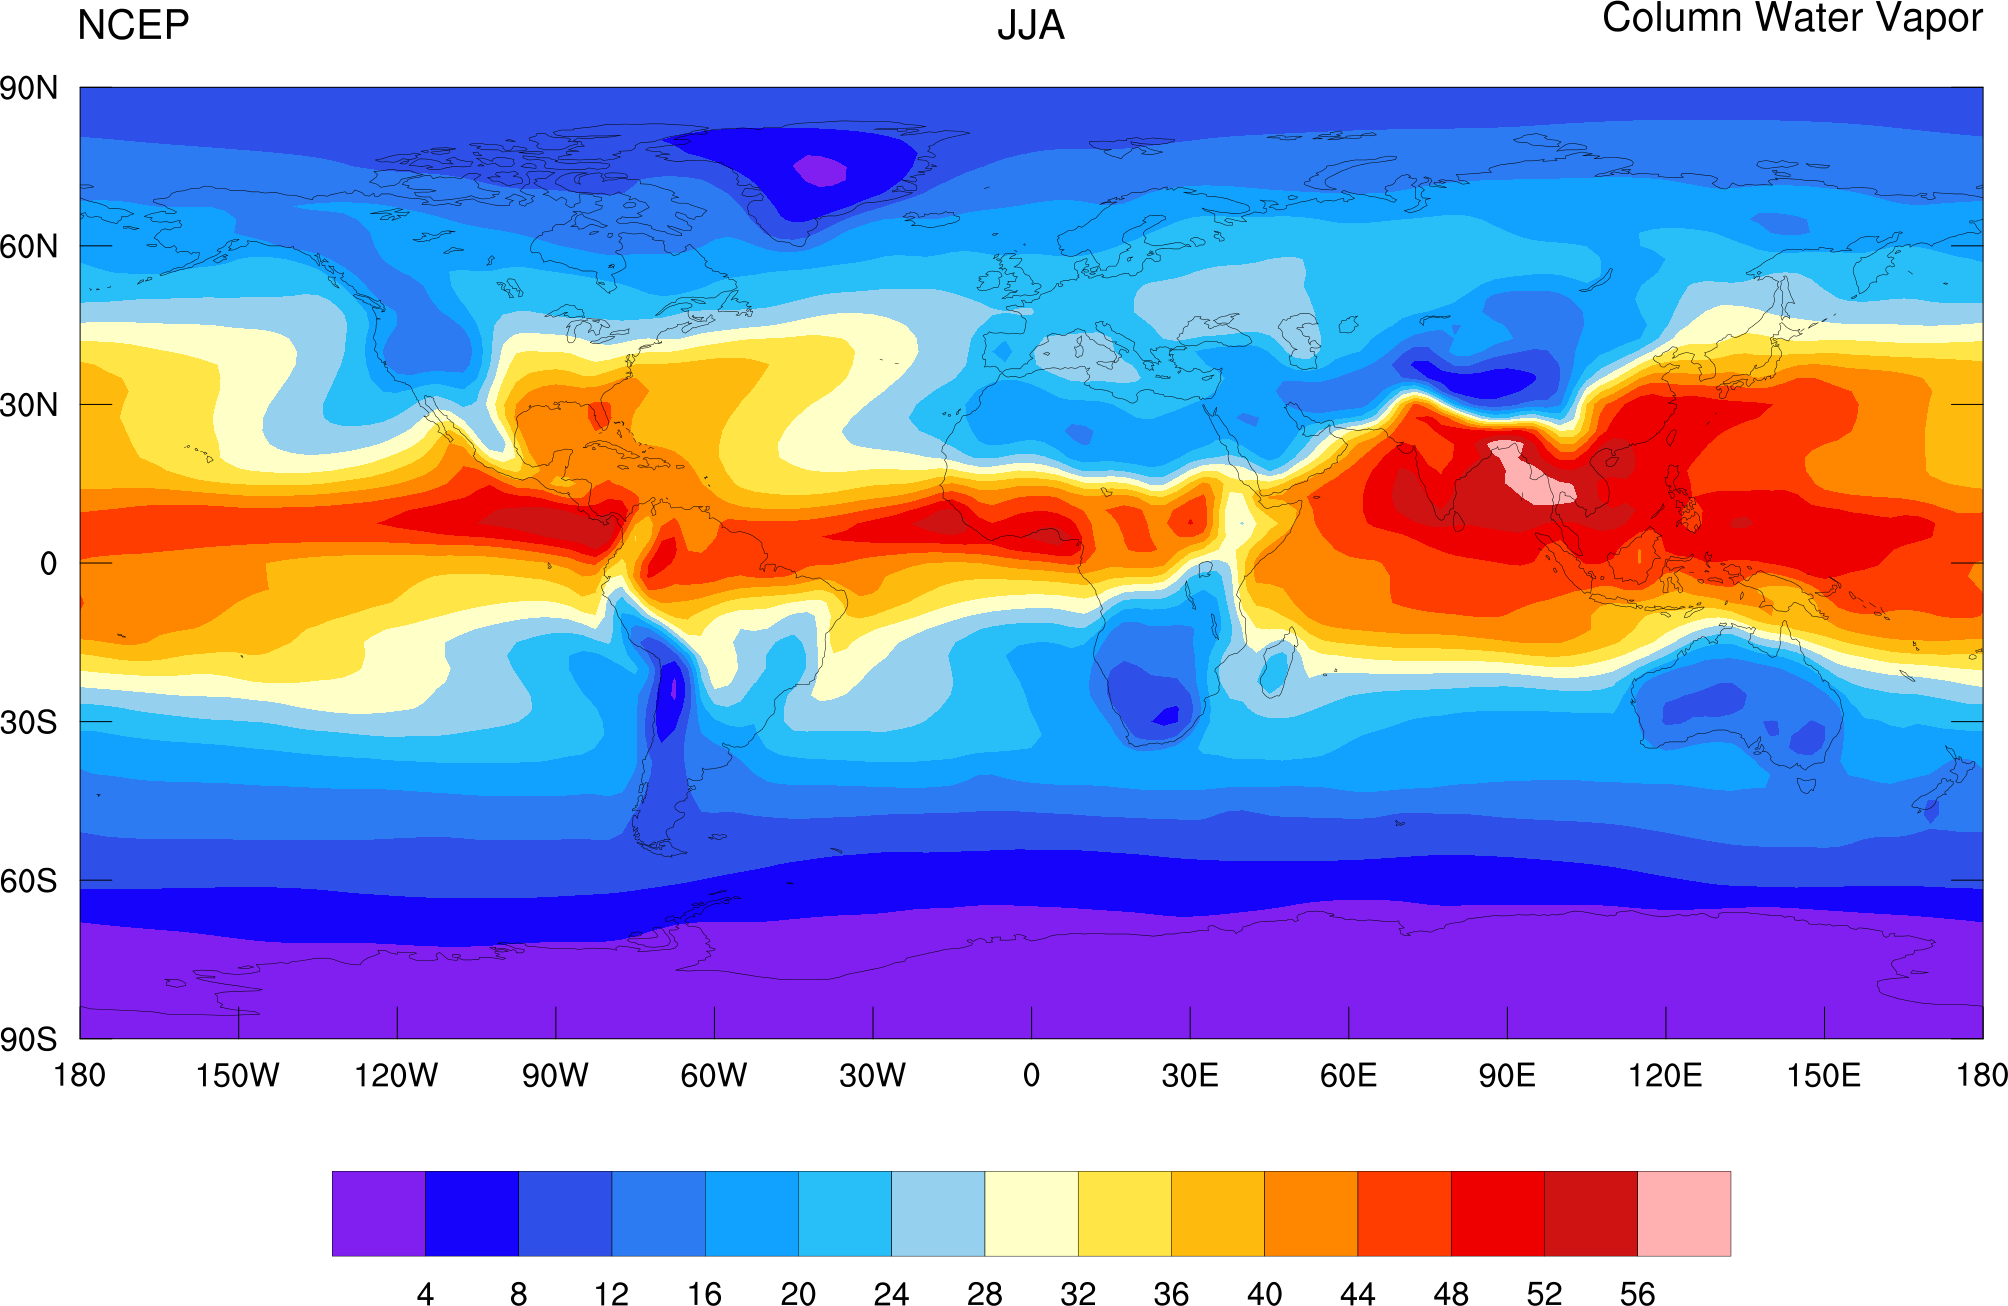
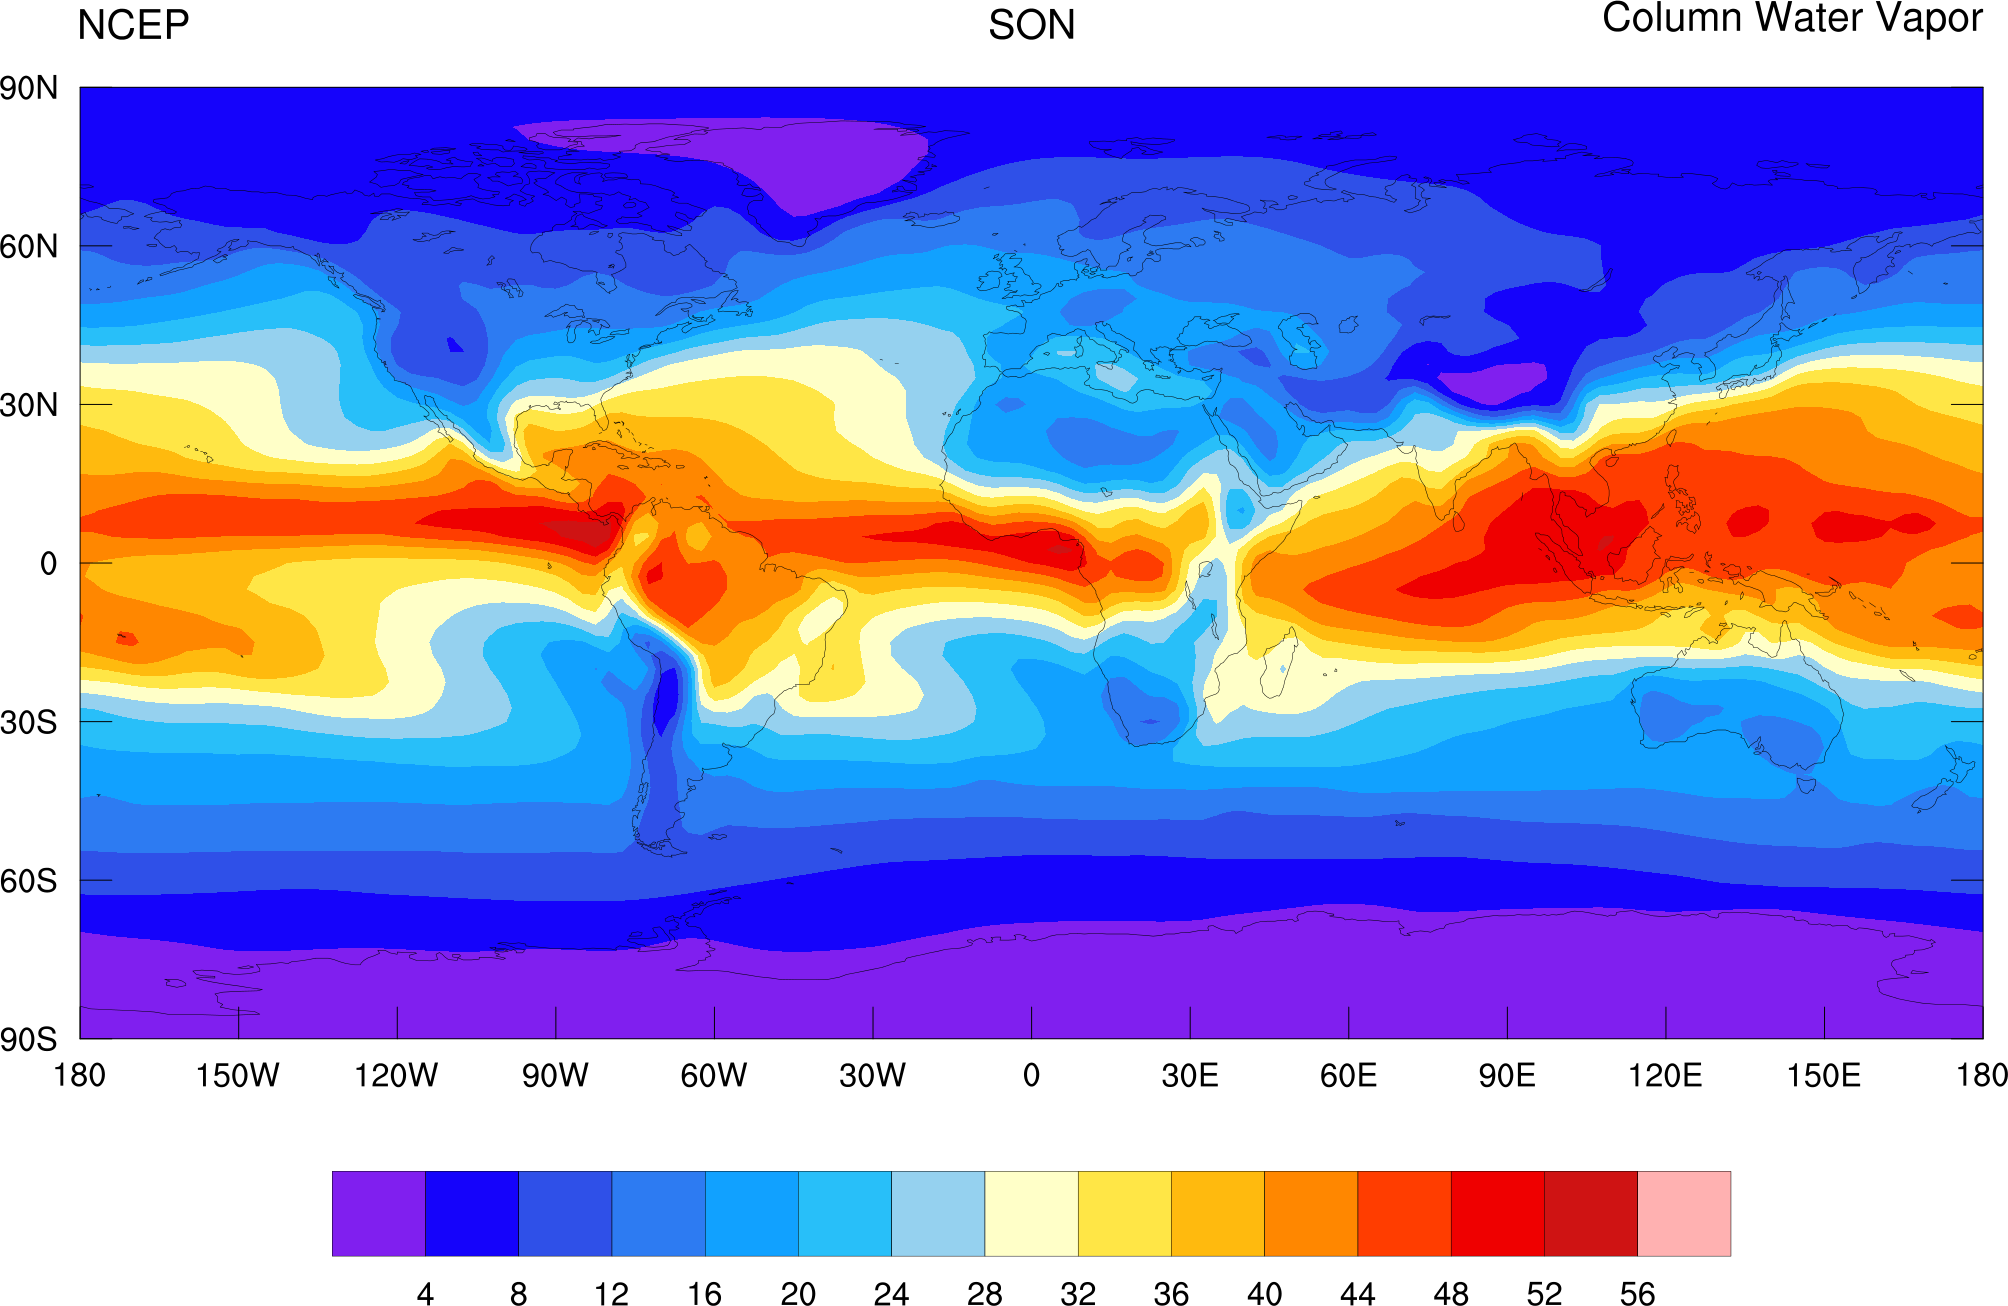
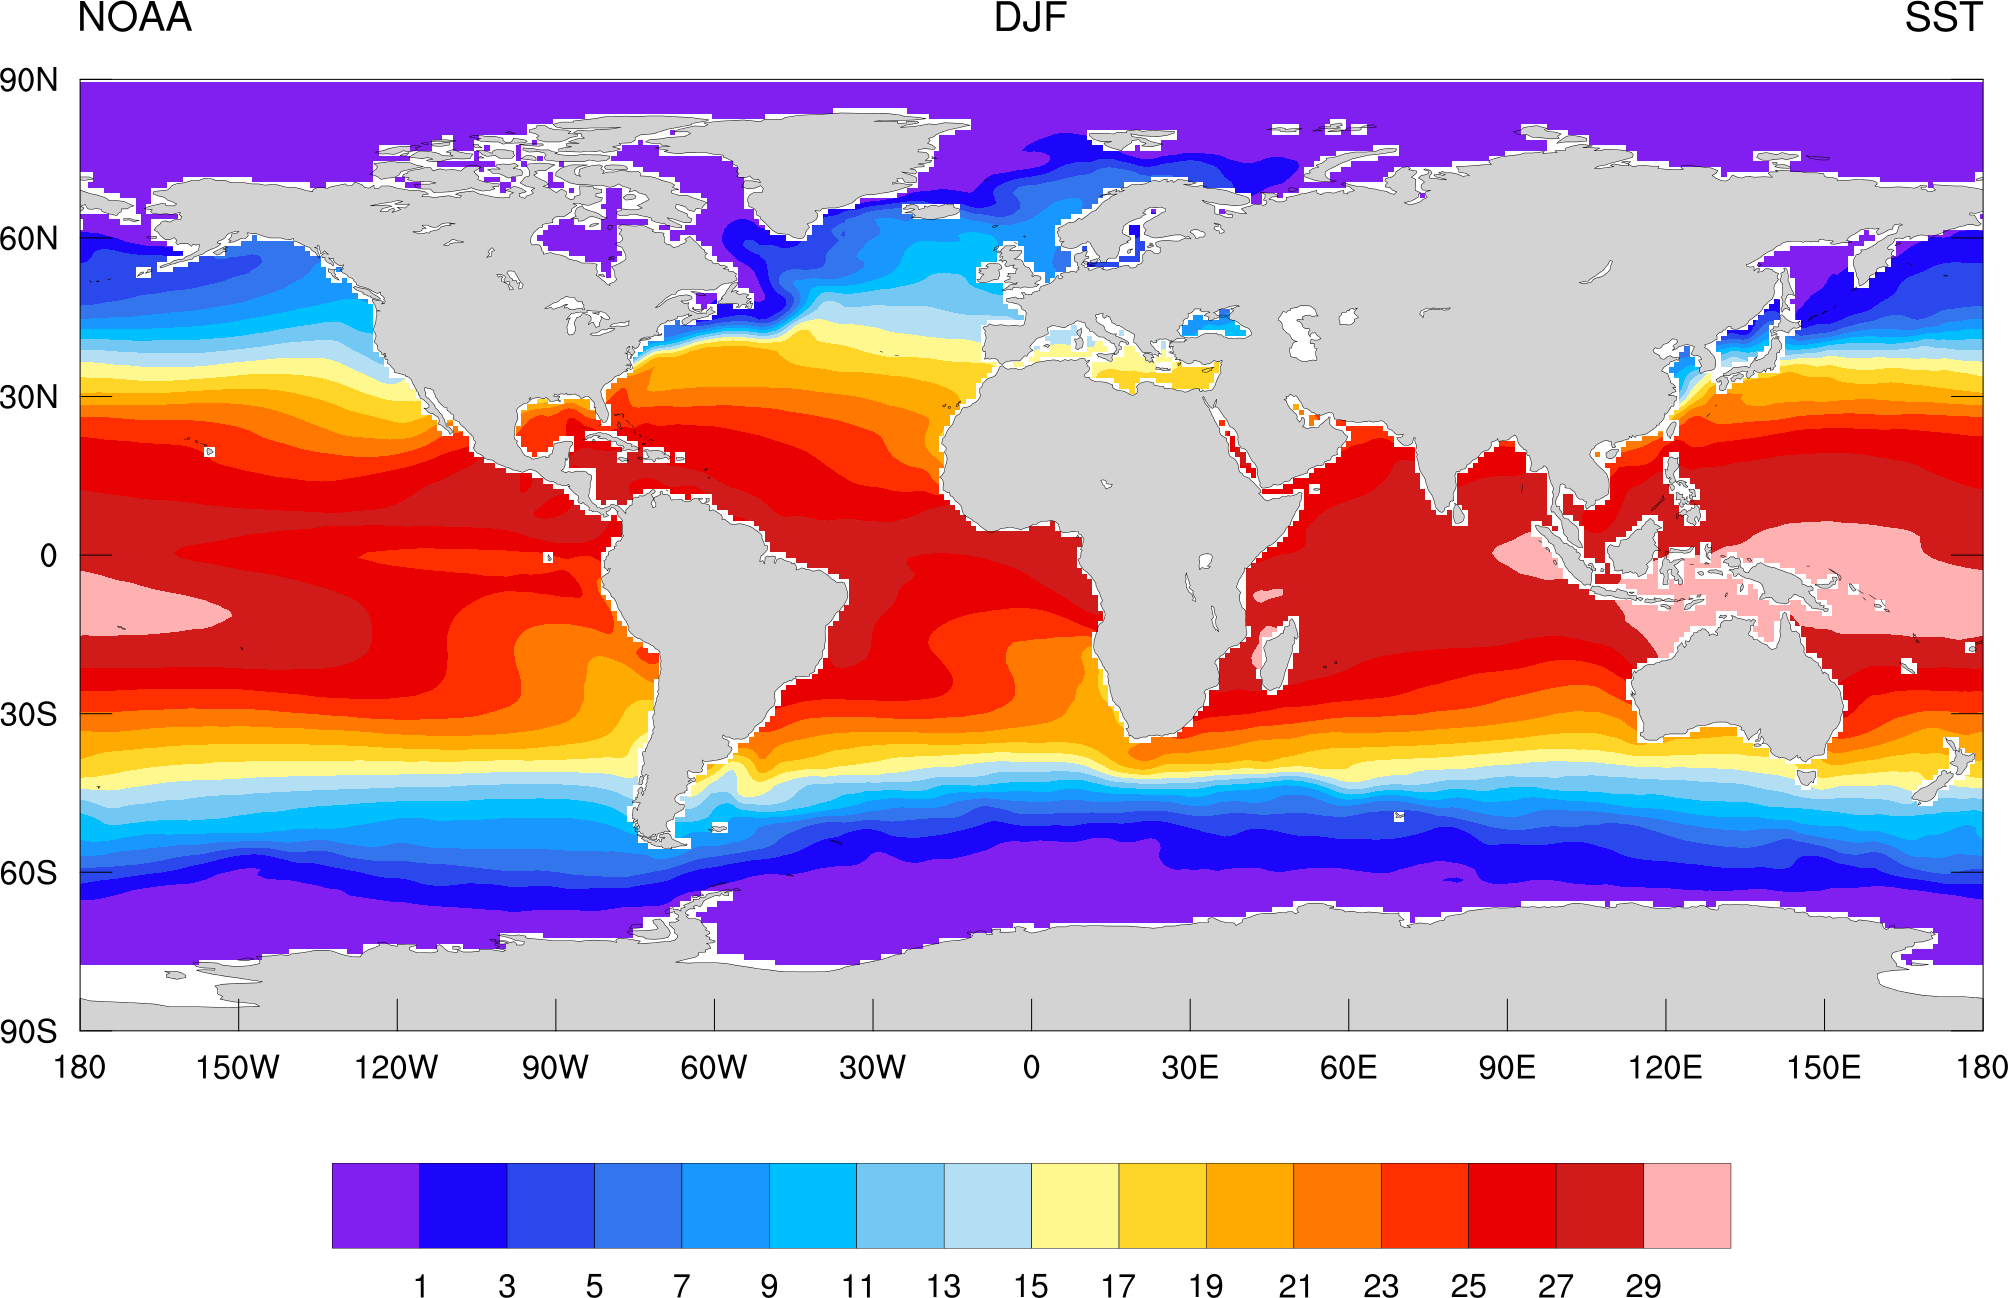
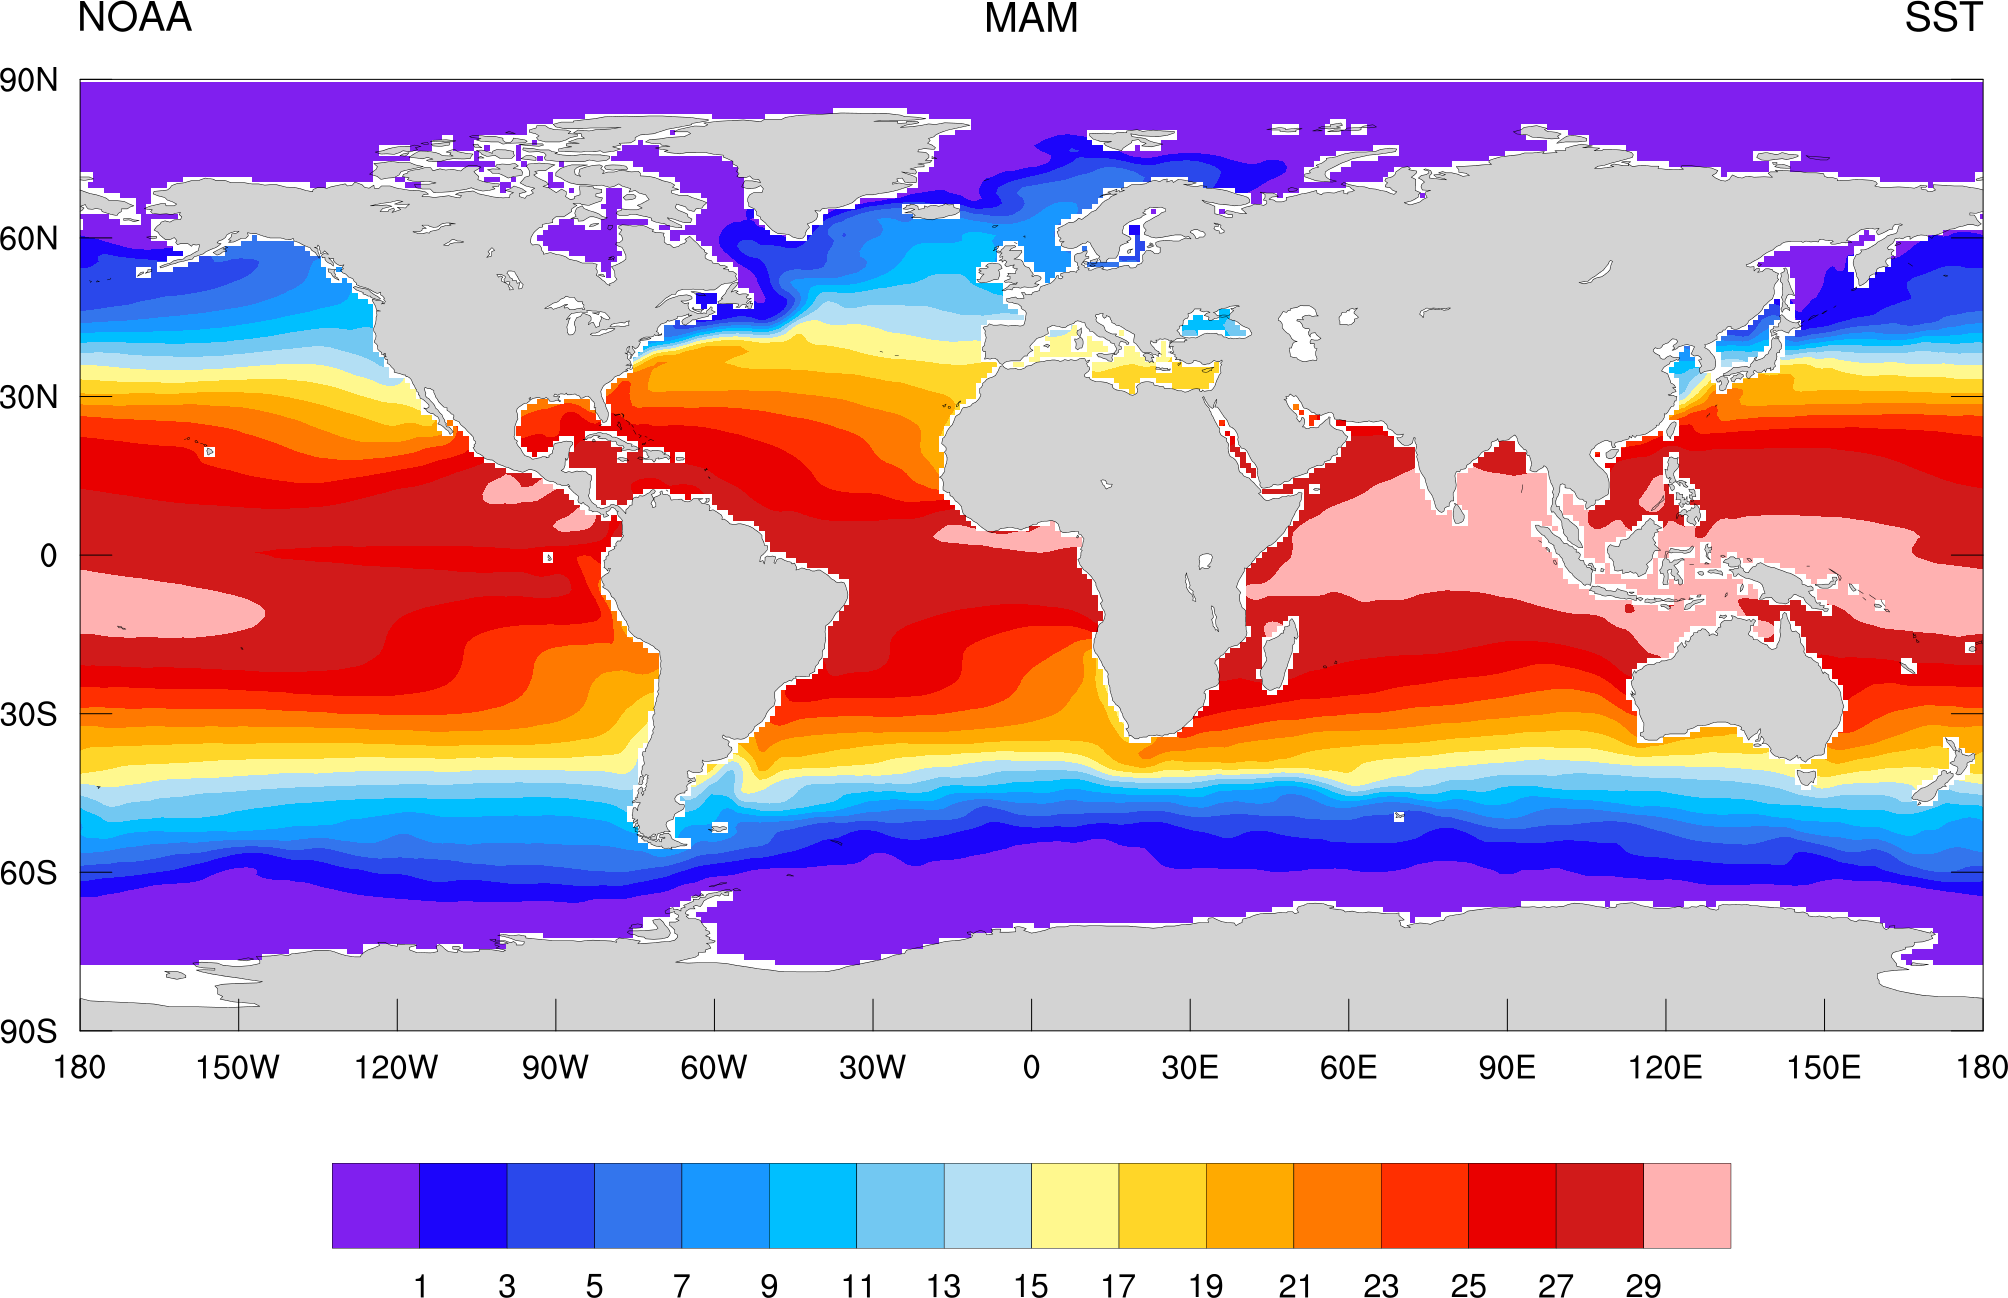
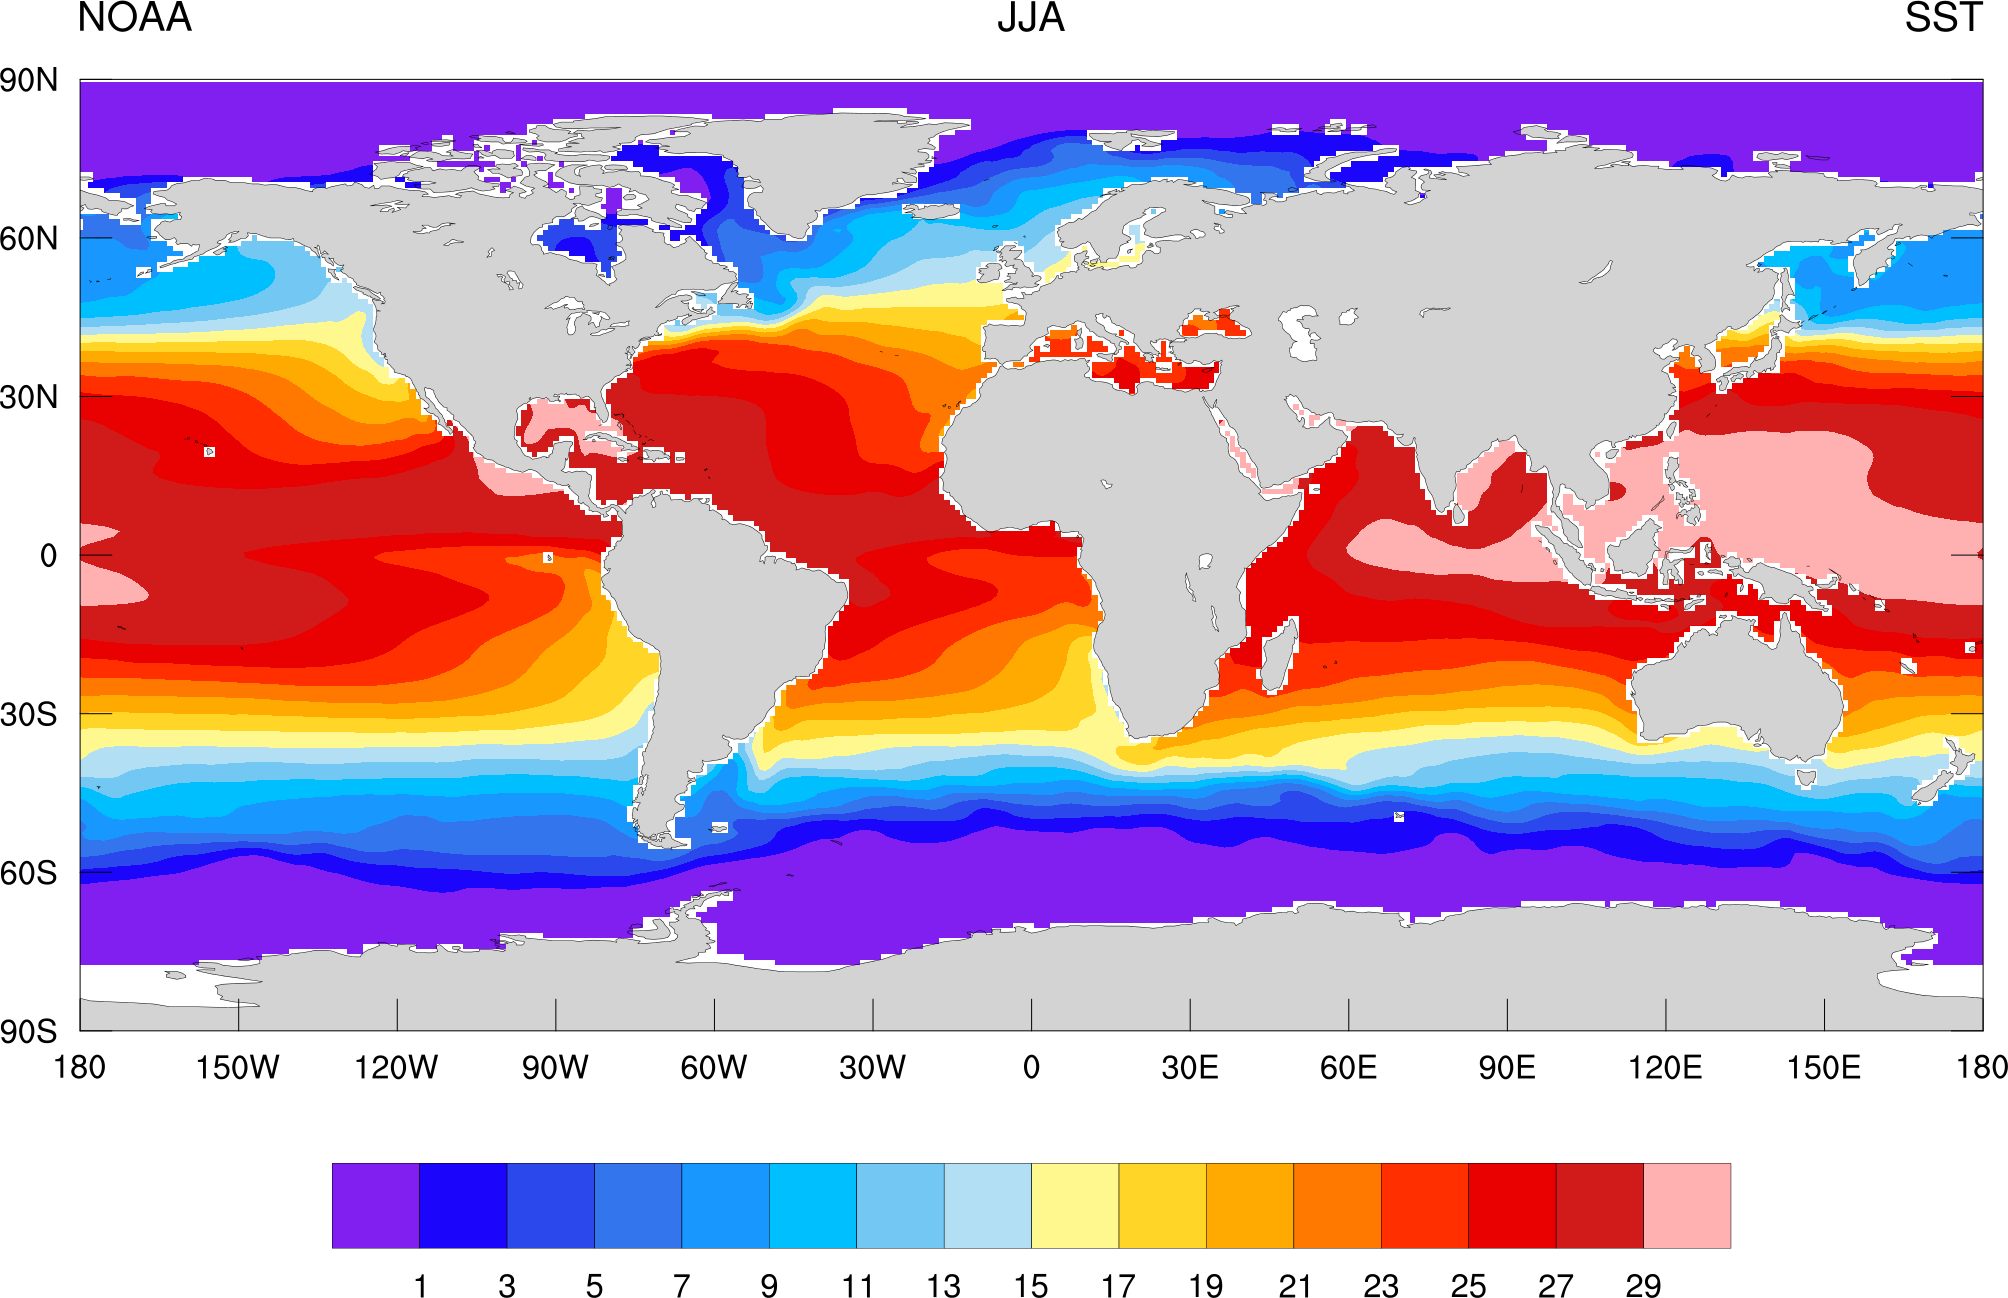
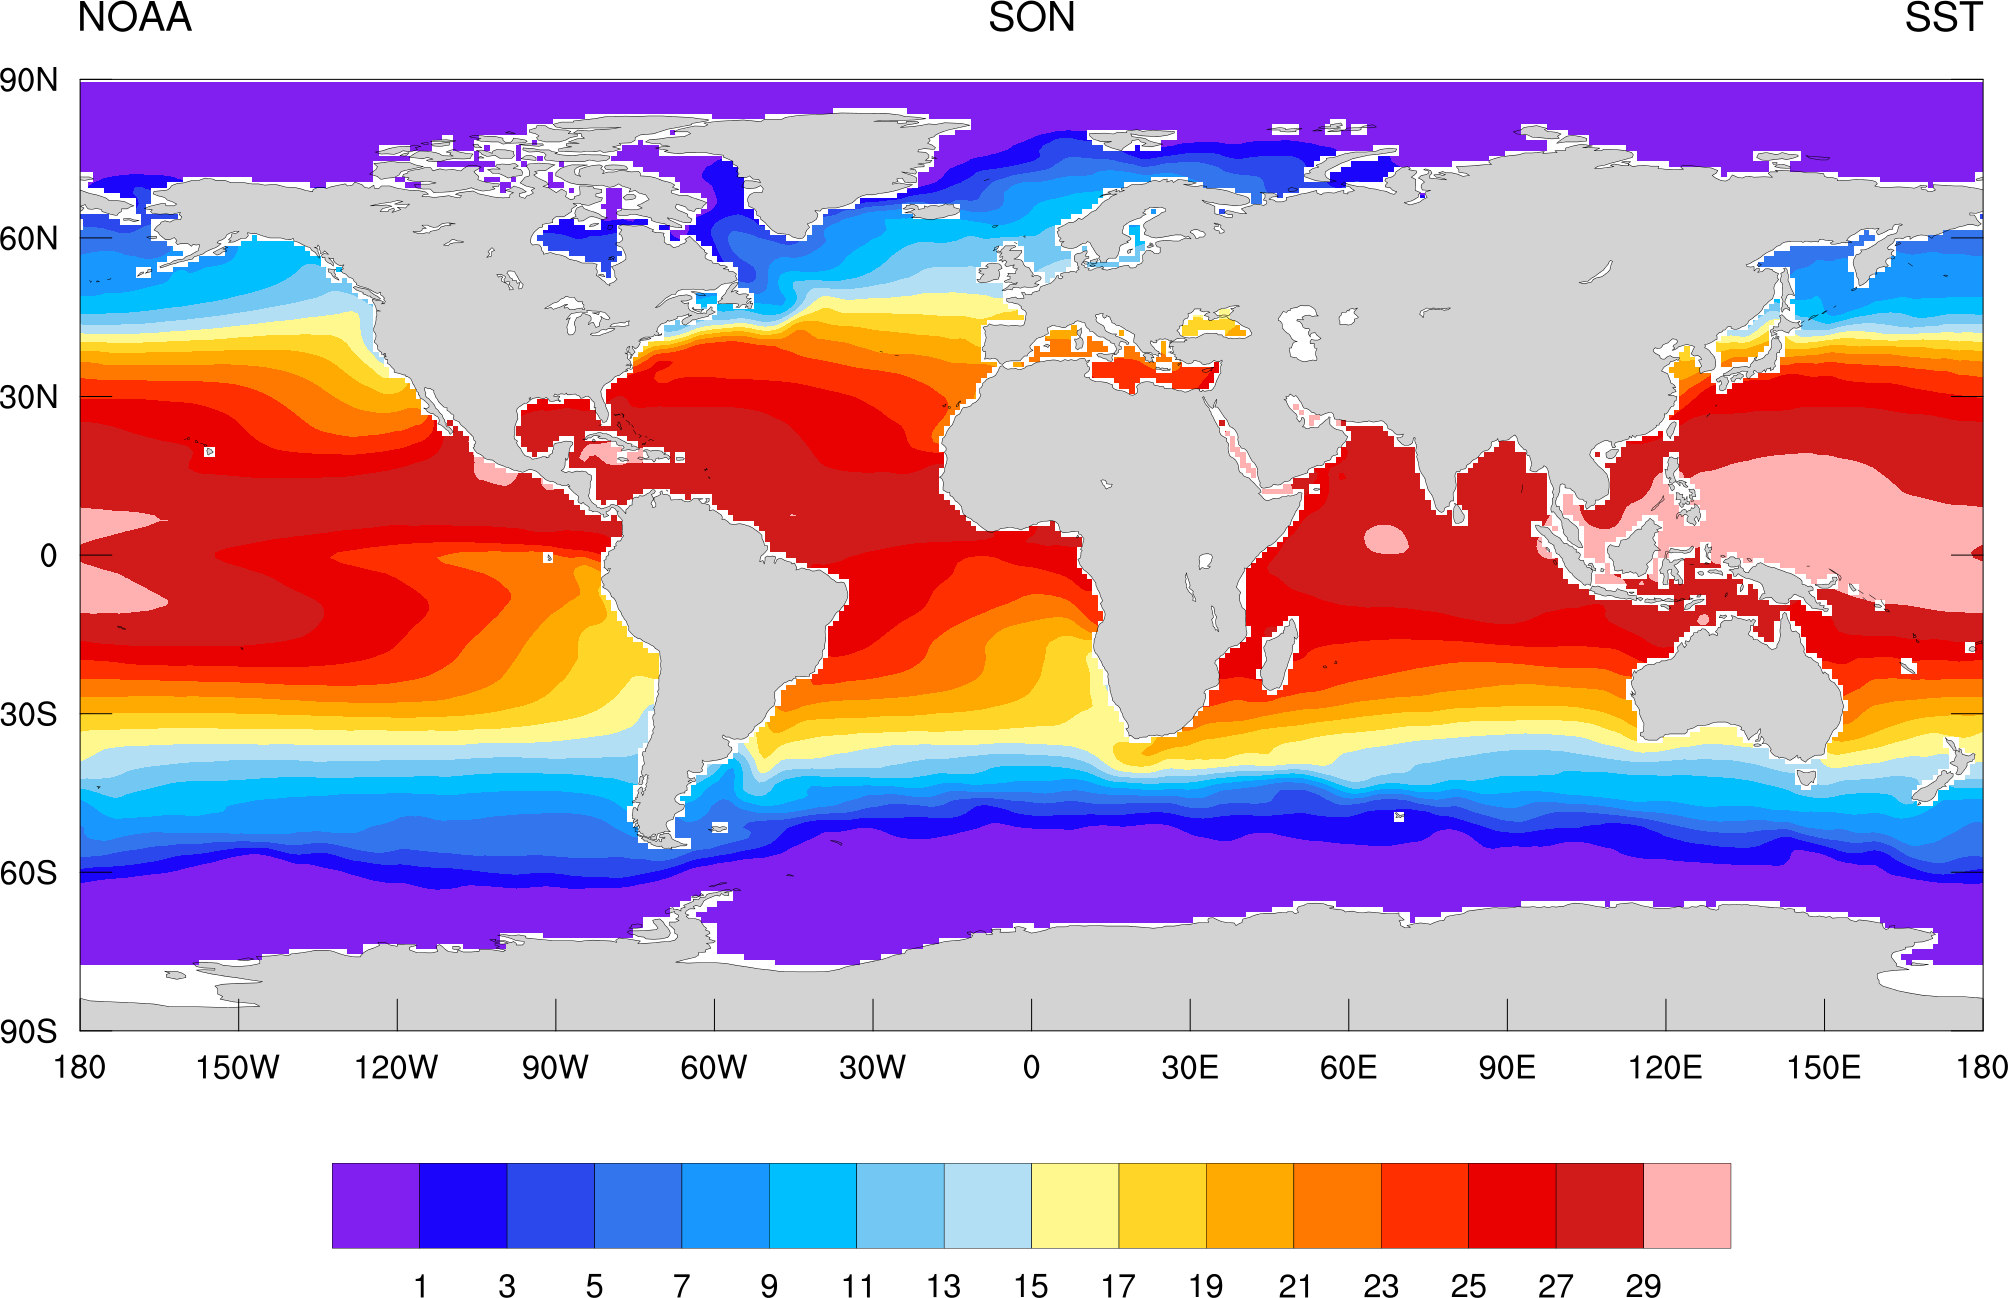
Climatological Maps
The table below shows maps of various meteorological variables for reference. Click on a map to enlarge it.
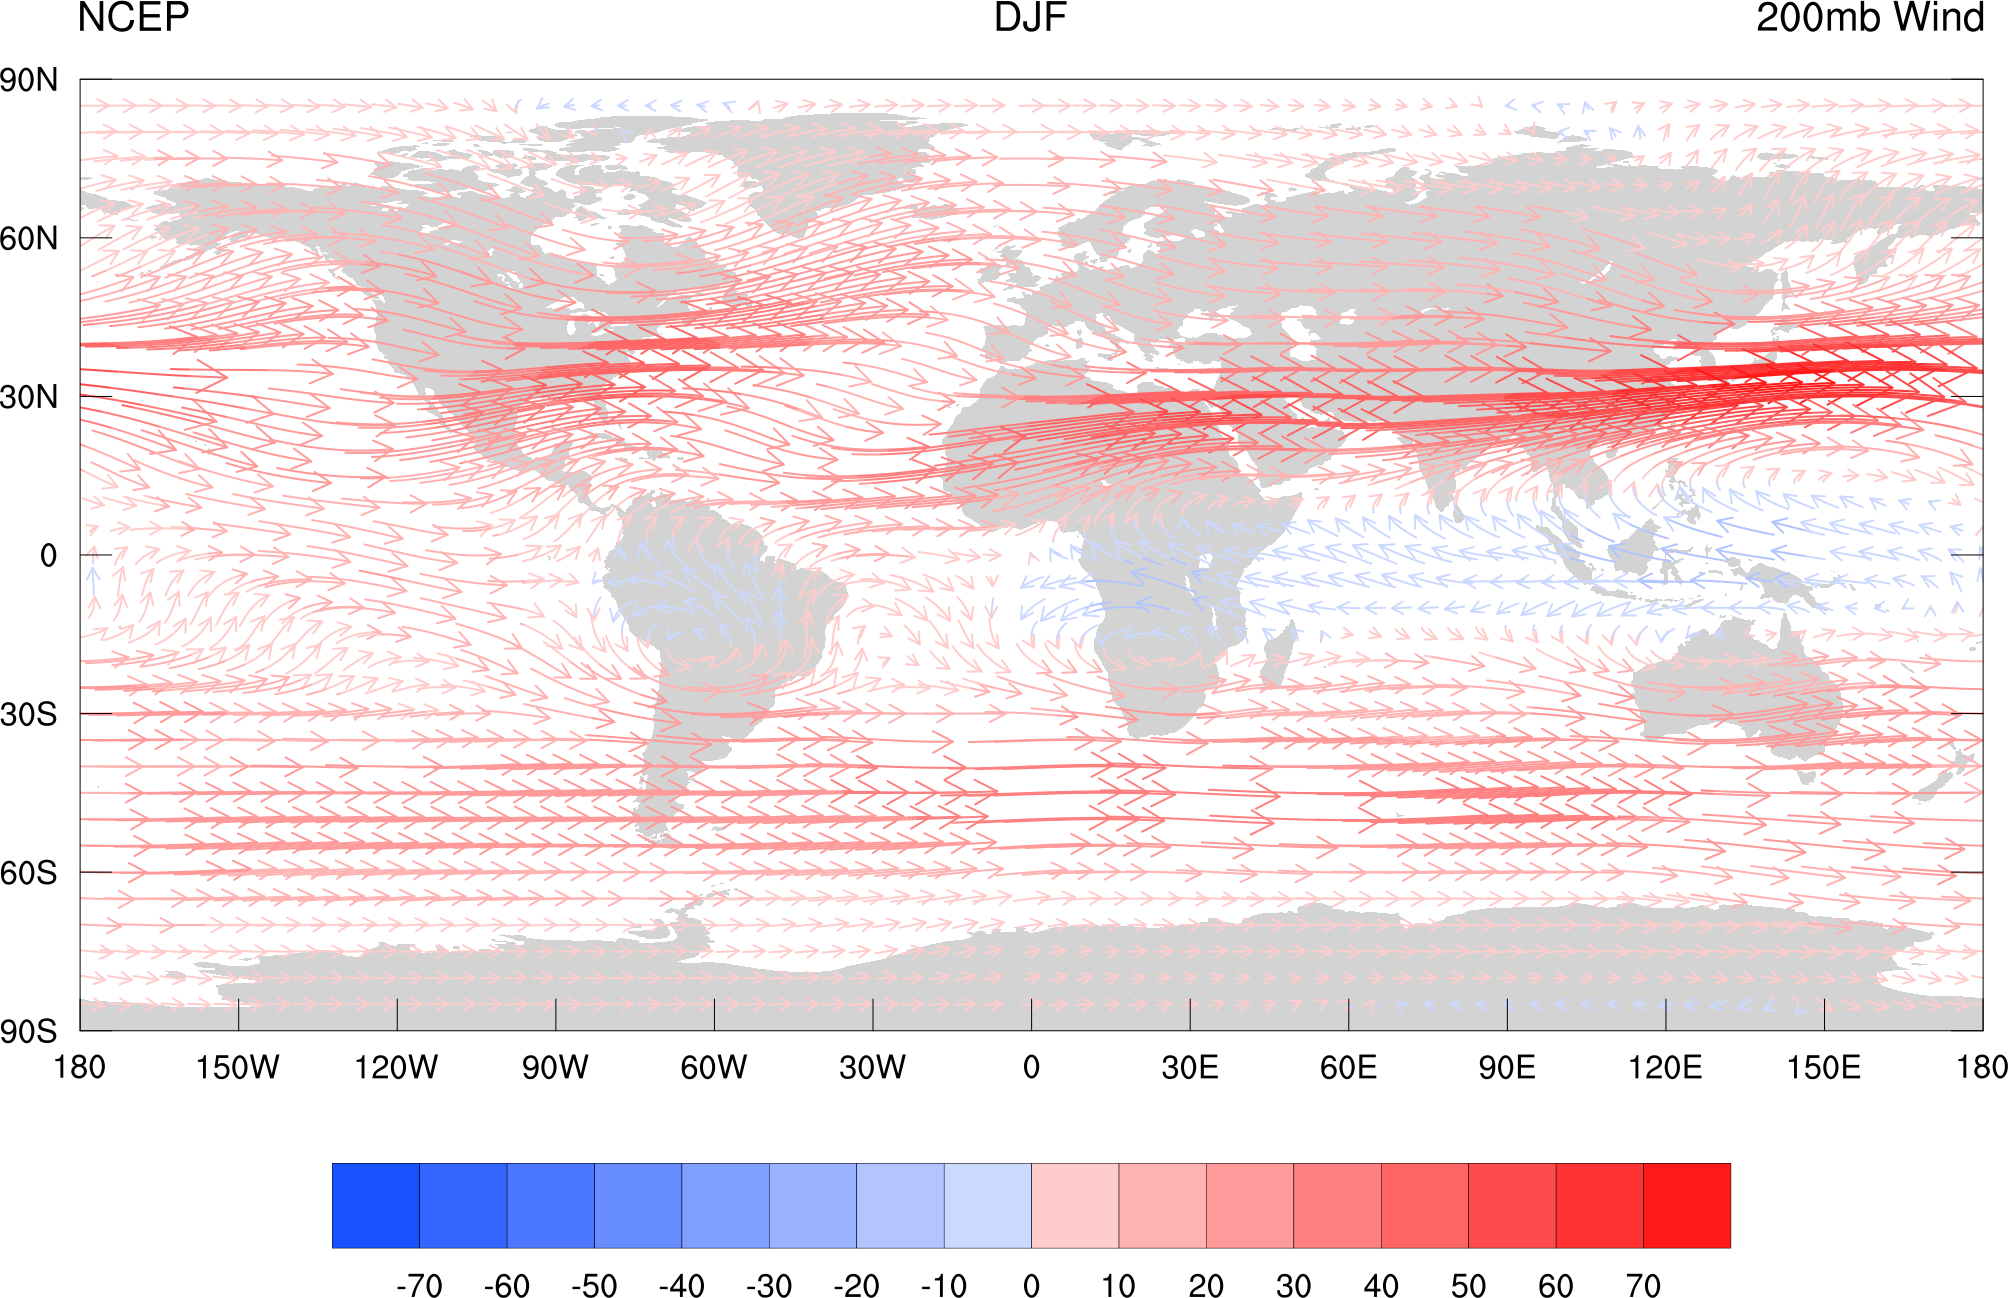
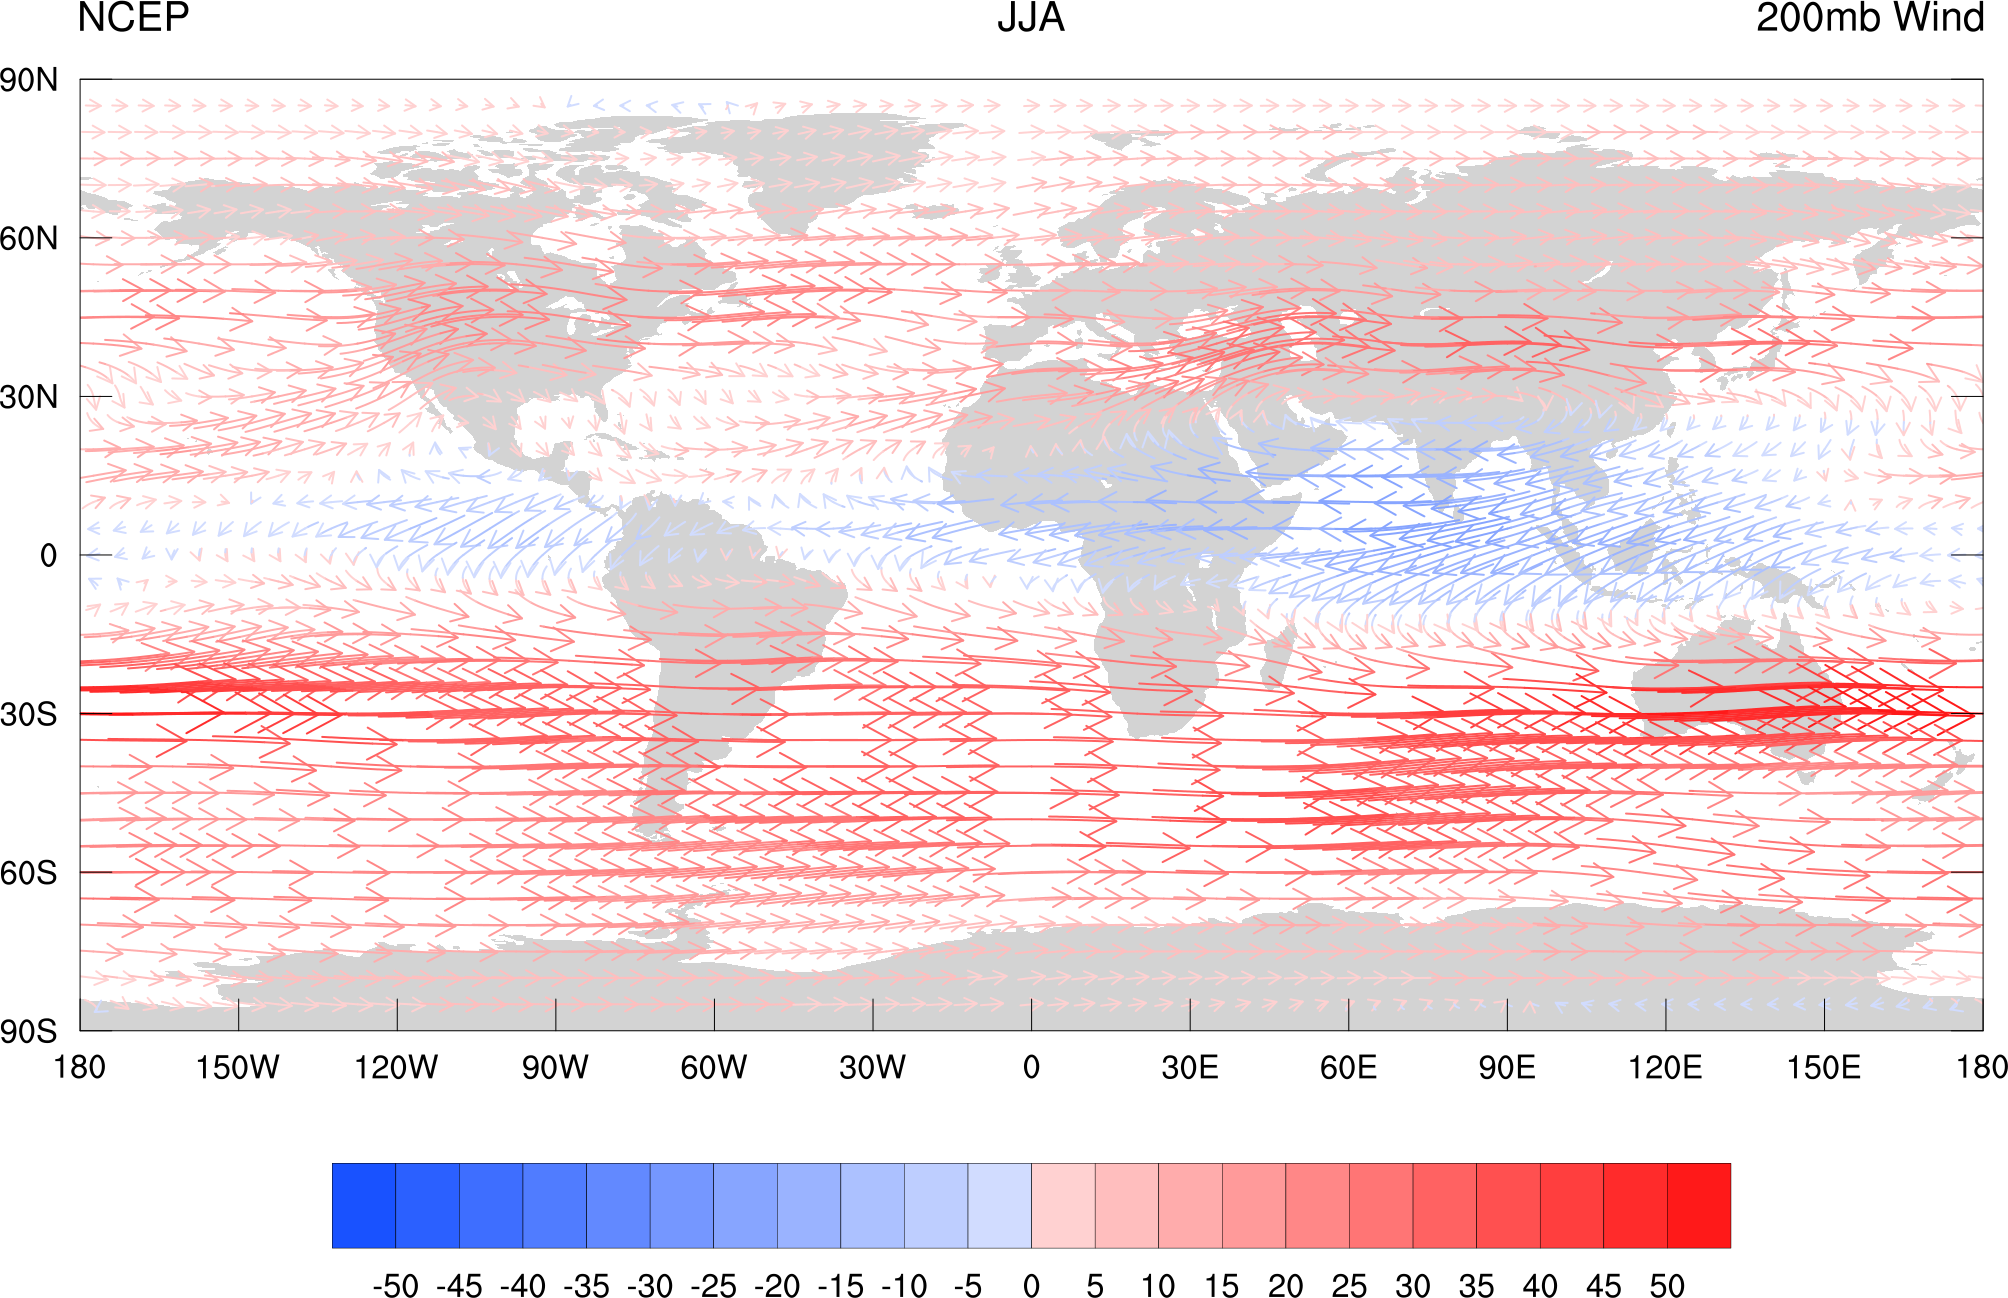
The data for these plots comes from the NCEP Reanalysis 2 dataset over the period 1979-2015.
Wind vectors are colored according to the magnitude of the zonal wind
| DJF | MAM | JJA | SON | |
|---|---|---|---|---|
| Upper Level Wind |
 |
 |
 |
 |
| Lower Level Wind |
 |
 |
 |
 |
| Column Water Vapor |
 |
 |
 |
 |
| Sea Surface Temperature |
 |
 |
 |
 |
This space doesn’t have much right now, but I intend to include several other metrics for a quick look at the global climate all in one place. In addition to the standard temperature datasets, I hope to eventually include other metrics such as
- sea level
- sea ice
- water vapor
- clouds