
I recently made some updates to my Atlantic Tropical Cyclone page. I cleaned up the look a bit, but more importantly I finished creating some visualizations for comparing the seasonal evolution of the environmental conditions in the main development region (MDR).
I was inspired to do this after reading this post on climate.gov about the 2013 Atlantic hurricane season. The 2013 hurricane season was exceptional in that forecasts predicted an above average year of activity, only to find out that it would be a below average year. The article does a nice job explaining how the seasonal average wind shear, vertical velocity, and humidity were all contributing to unfavorable conditions for tropical cyclone development.
This got me thinking that it would be great to have seasonal metrics available all the time! I didn’t want an overly complicated interface that gave me lots of flexibility and flashy graphics. I simply want to know the current seasonal average MDR conditions and know how they compare to other years.
Initially I was using GFS daily analysis, but this became problematic for comparing many years of data. It took up a lot of disk space and a lot of processing time. So I switched to monthly mean NCEP reanalysis and NOAA SST.
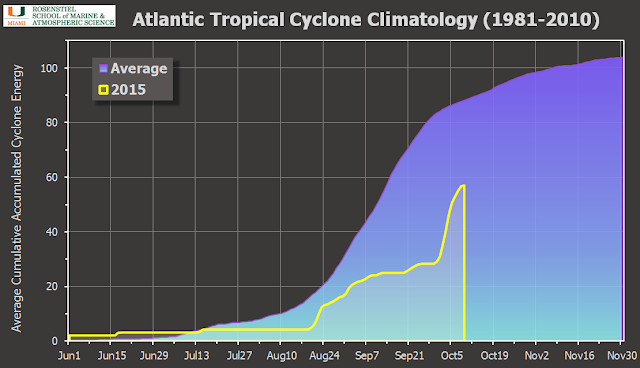
In spite of hurricane Joaquin, which was the strongest we’ve seen in the Atlantic since Igor in 2010, the 2015 season was notably quiet. This is nicely summarized in the plot of accumlated cyclone energy (ACE) below.
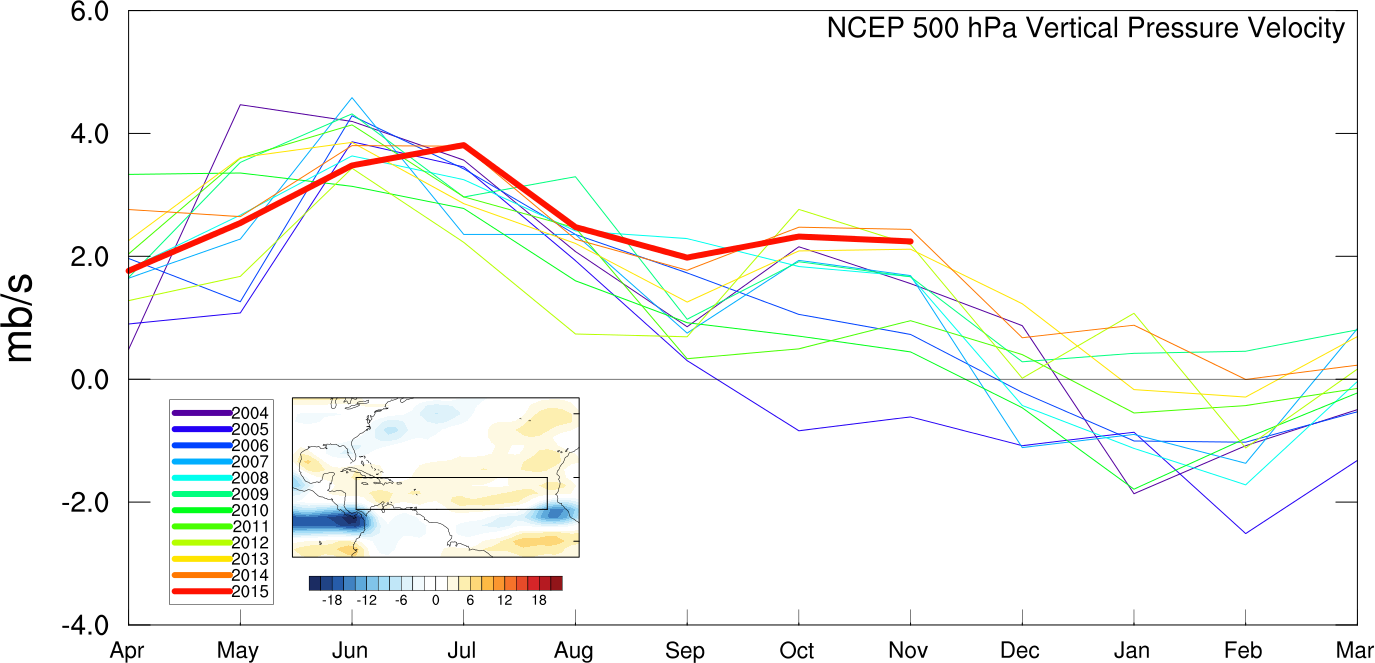
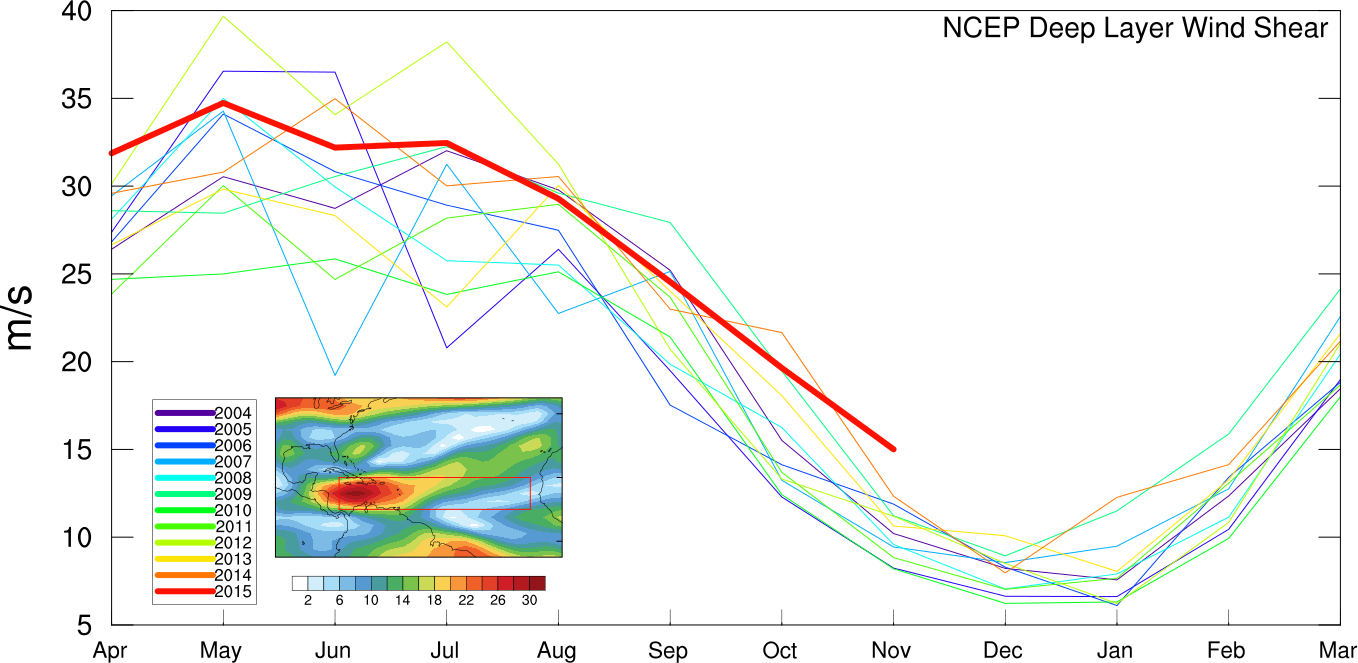
I’ve pasted the time series of monthly MDR conditions for the 2015 season. The thick red line is the current year of data, and the colors get colder for years farther in the past. These suggest that in the last two months the MDR has exhibited more subsiding air, which leads to anomalously dry conditions, and relatively high wind shear.

Following a suggestion by Brian McNoldy, I’m also going to add another curve for the long-term climatology. Hopefully hurricane people will find this useful!
I also added a Lightbox plugin, so the images will automatically zoom in when you click on them!