
This is one of the early seminal atmospheric modeling papers that dealt with the effects of anthropogenic CO2. Of course, we knew about the basics of how increased CO2 would affect the atmosphere ever since John Tyndall’s work in 1861, along with many others. Manabe and Wetherald were some of the first to explore this problem with an atmospheric model. This was made possible by the availability of computing power, which was paltry compared to the computers of today. Maybe even paltry when compared to a modern smartphone!
The GFDL model used in this study was initially developed during the 1950’s and 1960’s by Joseph Smagorinsky and Syukuro Manabe. Throughout the 1970’s most of these models were based on finite difference methods, in which the atmosphere is divided into boxes. It wasn’t until the 1980’s that spectral methods came into favor due to their computational efficiency for global simulations. Nowadays, models are trending back towards finite difference methods on more exotic grids, such as the MPAS and ICON models, or even finite element methods, which I have yet to fully understand.
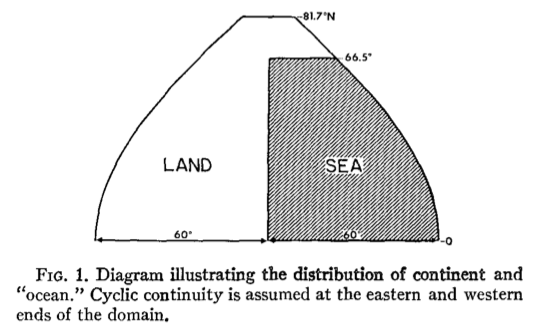
I was surprised to find that the model domain in this study was not global (see Fig. 1). Not only did it not extend all the way to the poles (because they used a mercator projection), it was also 120o wide in the longitudinal direction with cyclic boundaries. The land-sea distribution was very simple (see below). There was no interactive ocean model and the sea surface temperature remained fixed, which effectively makes the ocean surface like a swamp with an infinite supply of soil moisture for evaporation. It’s also worth noting that the ocean is not able to transport heat, which is a critical process in energy budget of the planet.
From all these simplifications it’s easy to see how one might be skeptical about whether climate models relate to the real world. But remember, understanding the global climate is about the balance of energy in and energy out. The simplicity of models like this make them easier to understand. This issue reminds me of a comment by Bjorn Stevens about how studies often seem to just want to make models more realistic, or point out how they aren’t realistic enough. He suggested a better way to think about models is as a tool for telling you where to look in the real world for interesting stuff (that you can hopefully learn from).
So anyway, the main goal of the paper is summed up nicely in the first sentence of the abstract:
“An attempt is made to estimate the temperature changes resulting from doubling the present CO2.”
The abstract also lists the three main results, which are now well understood consequences of increasing atmospheric CO2.
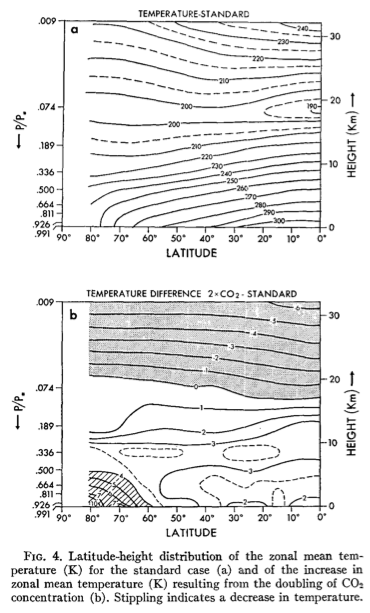
“…CO2 increase raises the temperature of the model troposphere, and lowers that of the model stratosphere.”
This first result can be seen clearly in Figure 4b (below). The cooling in the stratosphere is a key piece of our understanding here. I always bring this up when people ask questions about whether the observed global warming over the last few decades is caused by the sun or natural variability. If either the sun or natural variability were responsible for warming the troposphere there would be no reason to expect the stratosphere to cool.
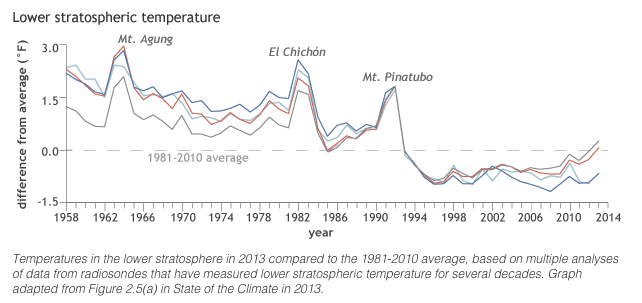
Below is a figure from climate.org that shows some observational evidence of stratospheric cooling. Evidence for stratospheric cooling can also be found using satellite data (Santer et al. 2013).
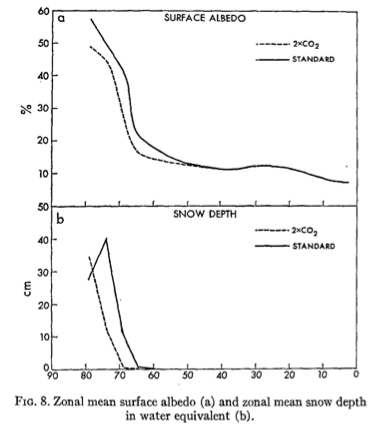
“The increase of surface temperature in higher latitudes is magnified due to the recession of the snow boundary…”
This is often referred to as the “ice-albedo feedback“. As the surface ice and snow thins and retreats, the surface reflects less solar radiation, and absorbs it instead. Notice in Figure 8b below that there is still snow at the poles in 2xCO2 simulation, so it’s not a scorching dystopia in this model’s warmer climate.
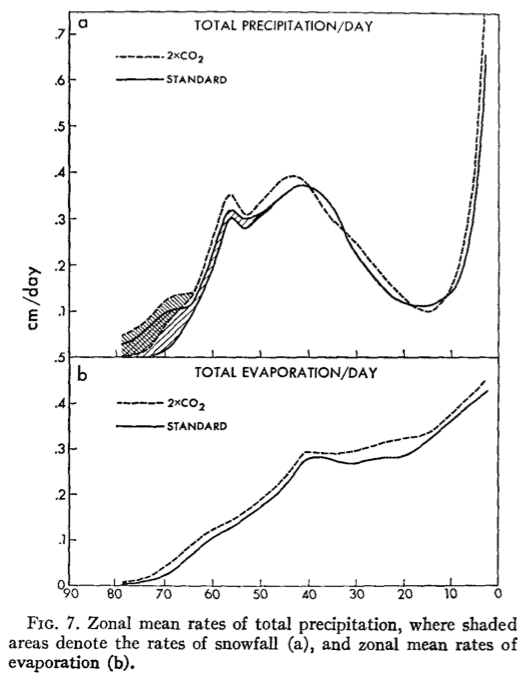
“…doubling of [CO2] significantly increases the intensity of the hydrologic cycle of the model.”
This third result is embodied by Figure 7 (below), but the figure doesn’t really seem that drastic the way it’s plotted. The global mean values are 2.55 mm/day in the control and 2.75 mm/day in the 2xCO2 simulation. This corresponds to an increase of 7%, but works out to be about 3.3% per degree change in surface temperature, which agrees well with other studies.
In spite of the computational restrictions that ultimately limited some aspects of the model, this study was able to reproduce some of the basic consequences of increased atmospheric CO2. And in the spirit of Bjorn Steven’s comment mentioned above, it helped point the way for future climate modeling studies.