I find the concept of inertial instability somewhat difficult to grasp. However, it seems to explain some interesting and important atmospheric phenomena, so I’m committed to wrapping my head around it. The current paper is an example of how inertial instability can be used to explain the seasonal behavior of the African monsoon system.
An Inertial oscillation in a simple system like a marble on a rotating parabolic table is an example of inertial instability at work. Standing beside the table (a) we would see the marble just rolling back and forth across the table, but a camera that was turning with the table would show the marble making circles on the table. Although, it’s hard to connect the role of inertial instability of this simple system to more complicated behavior in the atmosphere.
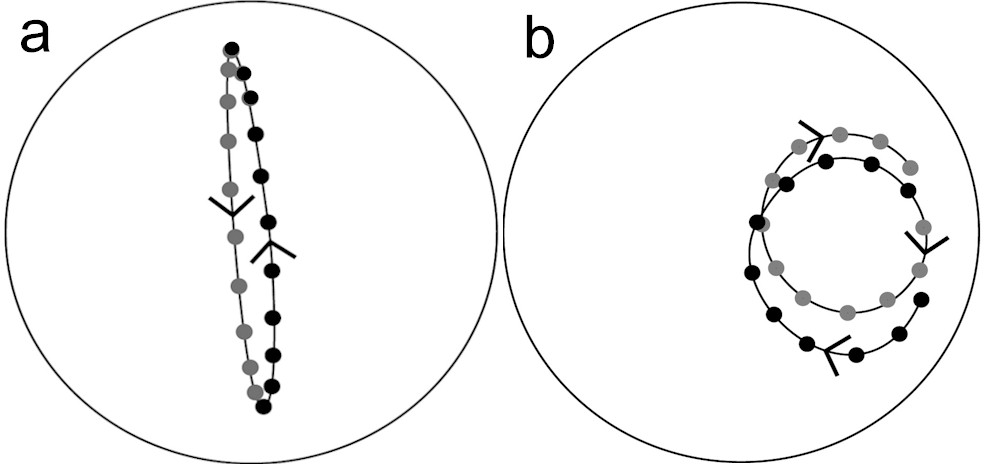
Trajectory of a marble on a rotating parabolic surface in (a) the inertial frame and (b) the rotating frame of reference. The parabola is rotating anti-clockwise (cyclonically). (taken from http://www-paoc.mit.edu/labweb/lab5/gfd_v.htm)
A more relevant understanding of inertial instability comes from considering the “parcel criterion” approach. To do this we can formulate a simplified expression that describes the meridional velocity, v, of a parcel displaced meridionally by δy,
![]()
From this we can easily see that if,
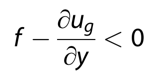
Then the parcel will continue to accelerate in the direction that it is displaced. This is the basic criteria for inertial instability that can be easily diagnosed from gridded wind data. Cook describes this more generally:
“The diagnosis of inertial instability, which represents a non-periodic solution to the governing momentum equation [Lorenz, 1963], is a focus of the analysis. Inertial instability involves only the horizontal flow and, as such, is a two-dimensional version of symmetric instability.”
But to really make use of this to help us understand the African monsoon, we need to know how this affects precipitation. This idea comes from a paper by Tomas and Webster (1997):
“Tomas and Webster [1997] consider the near-equatorial distribution of inertially unstable regions to understand how convection distributions near the equator are determined. They show that strong cross-equatorial surface pressure gradients lead to the development of inertial instability that influences the location of convective maxima similar to Plumb and Hou [1992]. When monsoon troughs develop in the summer hemisphere, the associated meridional pressure gradients position the zero line of absolute vorticity off the equator. Low-level divergence occurs between the equator and this zero line, with convection and upward motion poleward of it.”
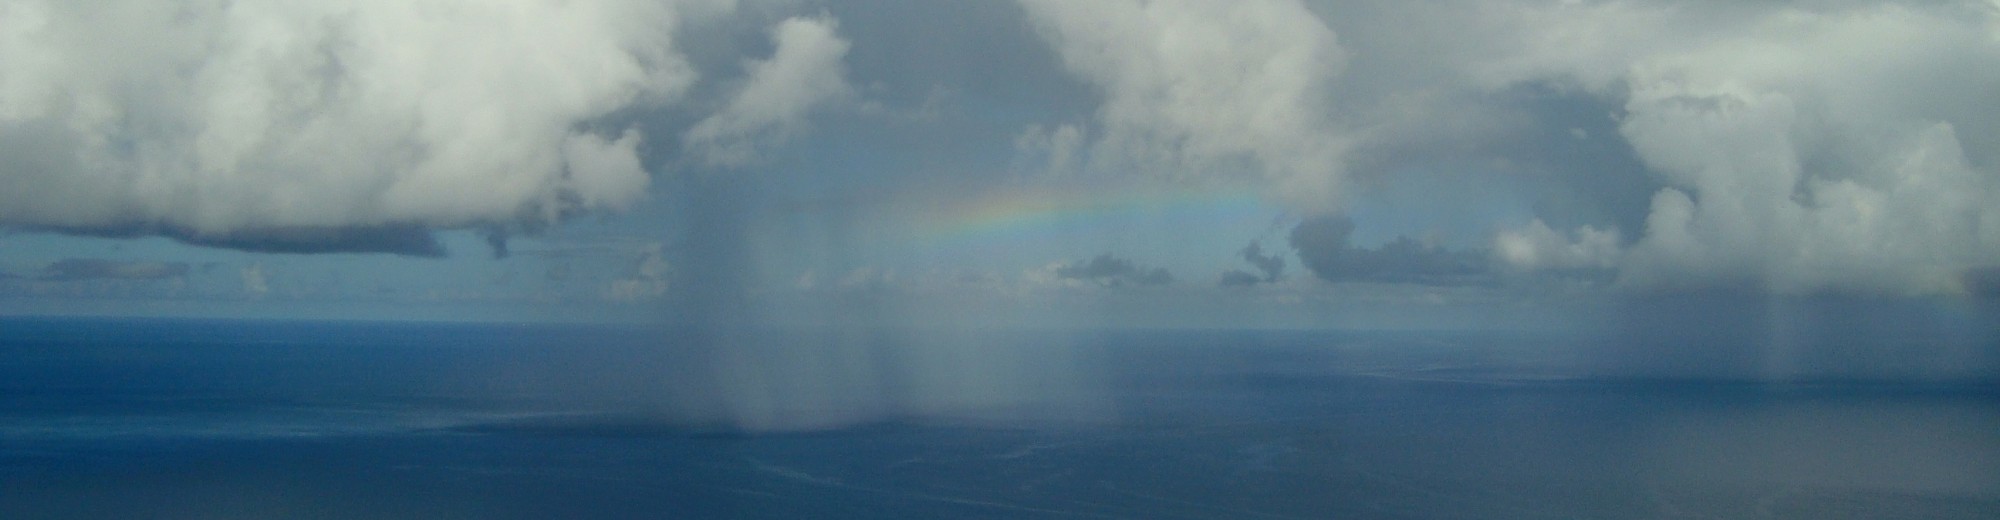
So, in a very basic sense, the presence of inertial instability leads to low-level divergence, which generally suppresses precipitation locally.
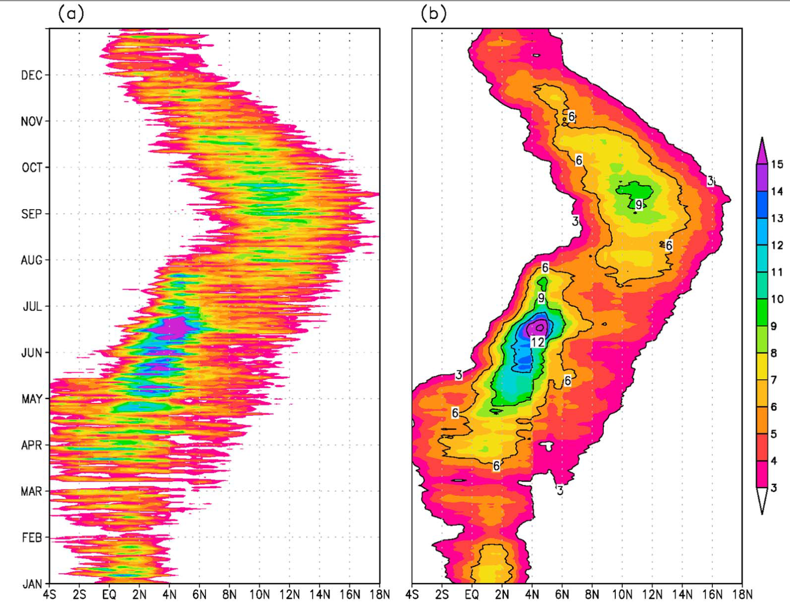
Seasonal average hovmoller of precipitation from TRMM averaged from 12°W to 6°E.
Back to the Monsoon jump. The hovmoller plot in figure above is a nice why to show the general behavior of the monsoon jump. The strongest precipitation over West Africa occurs near the coast during May-June. Then in July the maximum suddenly occurs much farther north.
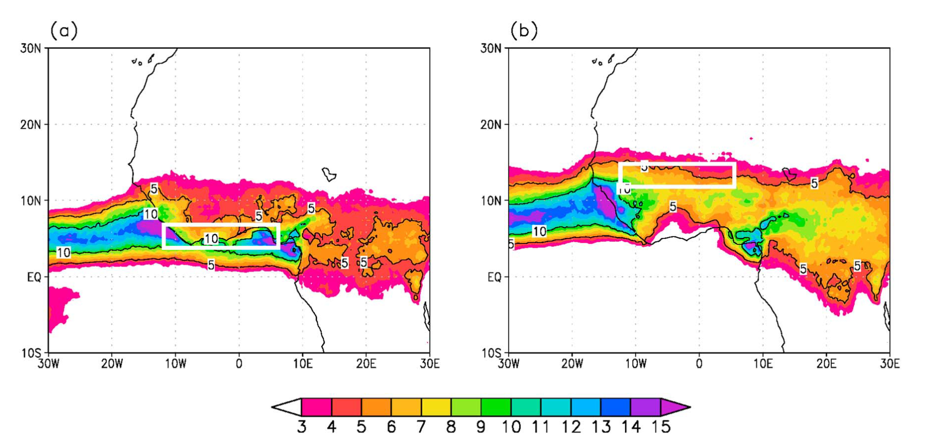
These maps show the average precipitation before (a) and after (b) the monsoon jump.
The timing of the monsoon jump is quantified by comparing West African precipitation at the Guinea coast and farther north over the Sahel (see boxes on map above). The date at which the Sahel precip exceeds the coastal precip is used to define the date of the jump (see below).
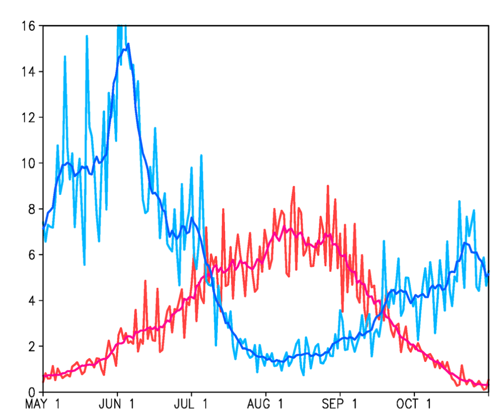
Timeseries of TRMM precip over the Guinea coast (blue) and Sahel (red).
Notice that the seasonal evolution of Sahel precip evolves slowly and steadily, whereas the Guinea coast precip exhibits an abrupt drop during the first week of July. This abrupt decrease at the coast is what causes the jump.
The really interesting thing about using inertial instability to explain the jump is that inertial instability only happens sporadically, and on synoptic timescales. This means that we cannot diagnose inertial instability if our horizontal resolution is too coarse! This applies to both time and spatial resolution, but is mostly relevant to spatial resolution and whether they can resolve synoptic disturbances.
The figure below shows this by comparing an inertial instability index from coarse ERA-interim reanalysis (red) and a much finer operational analysis (gray). The red line is much lower during July and August, but not negative. On the other hand, the gray line occasionally becomes negative, which suggests that inertial instability is suppressing precipitation at the coast. This is probably why most climate models cannot reproduce the jump.
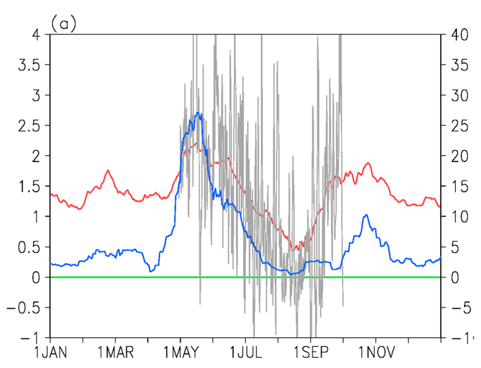
Inertial instability parameter at 700 hPa for 2006 averaged over 0°-5°W and 3°-5°N from the ERAI 1.5° reanalysis (red) and the OPERA-WAFR 0.25° reanalysis (gray line). Trmm precip over the Guinea coast is show in blue.
These episodes of inertial instability might be related to African easterly waves (Sultan and Janicot 2000).
Cook argues that the steady northward movement of the African easterly jet, combined with the threshold for instability, shows that the movement of the jet causes the drop in Guinea coast rainfall. He also explains that the data does not support the opposite causality (the drop in rainfall causes the jet to shift), because this would result in a sudden shift of the jet, which does not happen.
For a more in-depth discussion on the fundamentla mathematics behind inertial stability check out these notes by David Randall. Another interesting paper related to this subject I came across is by Tomas and Webster (2010), which focuses on easterly waves in the Eastern Pacific.